
June 16, 2026 a 03:31 pm

WDC: Dividend Analysis - Western Digital Corporation
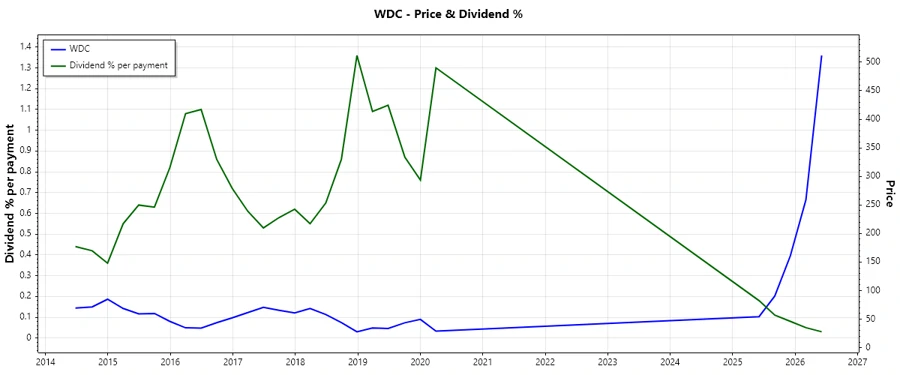
Western Digital Corporation presents a challenging dividend profile with a current yield of approximately 0.098%. While the company has a historical commitment to dividends with 11 years of payments, recent trends show a reduction in dividend growth rates, posing questions to potential investors. The stability of its financial position and future growth prospects warrant careful consideration.
📊 Overview
Western Digital Corporation operates in the Technology sector with a notable focus on data storage solutions. The current dividend yield stands at 0.098%, based on a dividend of 0.127 USD per share, with a respectable history of 11 consecutive years of dividend payments.
| Category | Details |
|---|---|
| Sector | Technology |
| Dividend Yield | 0.0977 % |
| Current Dividend per Share | 0.127 USD |
| Dividend History | 11 years |
| Last Cut or Suspension | None |
🗣️ Dividend History
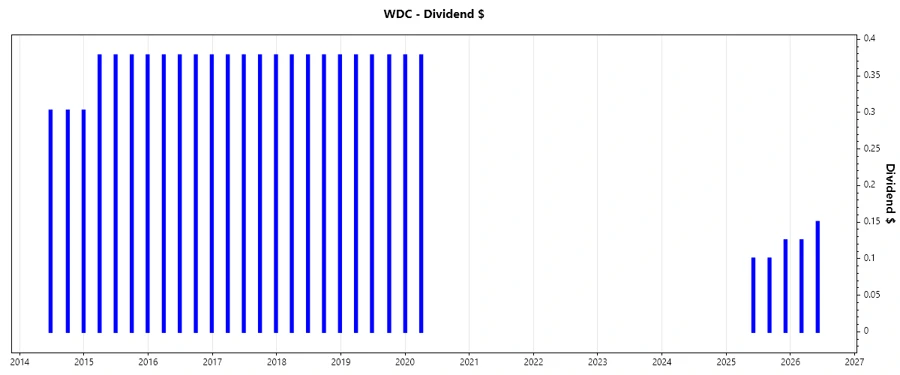
The consistency of dividend payments over the years demonstrates Western Digital's commitment to returning value to shareholders. However, past cuts can signal potential volatility.
| Year | Dividend per Share (USD) |
|---|---|
| 2026 | 0.275 |
| 2025 | 0.325 |
| 2020 | 0.75562 |
| 2019 | 1.13343 |
| 2018 | 1.51124 |
📈 Dividend Growth
Analyzing the dividend growth helps investors gauge the company's ability to increase shareholder returns. The downturn over the past few years raises concerns about the future payout potential and overall financial health.
| Time | Growth |
|---|---|
| 3 years | -24.52 % |
| 5 years | -15.53 % |
The average dividend growth is -15.53% over 5 years. This shows a declining trend in dividend distributions, potentially affecting long-term income sustainability.
📉 Payout Ratio
The payout ratio is an essential measure of a company’s ability to sustain its dividends. Western Digital exhibits a payout ratio of 67.45% based on EPS, suggesting a significant portion of its earnings are allocated towards dividends.
| Key Figure | Ratio |
|---|---|
| EPS-based | 67.45 % |
| Free Cash Flow-based | 150.45 % |
The payout ratio based on EPS is high, indicating a potential risk of dividend cuts if earnings do not improve. The FCF-based ratio further underlines challenges in funding dividends from cash flows.
✅ Cashflow & Capital Efficiency
Cash flow analysis is pivotal in understanding a company's liquidity and operational efficiency. A strong cash flow supports sustained dividend payouts and growth investments.
| Metric | 2025 | 2024 | 2023 |
|---|---|---|---|
| Free Cash Flow Yield | 5.85 % | -4.18 % | -13.33 % |
| Earnings Yield | 8.47 % | -4.28 % | -18.48 % |
| CAPEX to Operating Cash Flow | 24.07 % | -165.65 % | -197.79 % |
| Stock-based Compensation to Revenue | 2.78 % | 4.67 % | 5.08 % |
| Free Cash Flow/Operating Cash Flow Ratio | 75.93 % | 265.65 % | 297.79 % |
The negative free cash flow yields in 2024 and 2023 highlight operational challenges. Although improved in 2025, stability remains a concern.
⚠️ Balance Sheet & Leverage Analysis
Understanding leverage and balance sheet metrics helps evaluate the company’s long-term financial stability and risk exposure.
| Metric | 2025 | 2024 | 2023 |
|---|---|---|---|
| Debt-to-Equity | 95.67 % | 72.32 % | 77.29 % |
| Debt-to-Assets | 36.29 % | 32.35 % | 34.52 % |
| Debt-to-Capital | 48.89 % | 41.97 % | 43.59 % |
| Net Debt to EBITDA | 1.53 | 25.81 | 22.32 |
| Current Ratio | 1.49 | 1.32 | 1.45 |
| Quick Ratio | 0.84 | 1.10 | 0.77 |
| Financial Leverage | 2.64 | 2.24 | 2.24 |
Western Digital’s balance sheet indicates considerable leverage, with high debt levels in 2023-2024, necessitating prudent debt management strategies.
📊 Fundamental Strength & Profitability
Profitability ratios assess the company’s ability to generate earnings relative to sales, assets, and equity, reflecting operational efficiency.
| Metric | 2025 | 2024 | 2023 |
|---|---|---|---|
| Return on Equity | 35.04 % | -7.38 % | -15.36 % |
| Return on Assets | 13.29 % | -3.30 % | -6.86 % |
| Margins: Net | 19.55 % | -12.63 % | -26.92 % |
| EBIT | 15.62 % | -5.14 % | -8.62 % |
| EBITDA | 20.36 % | 3.85 % | 4.62 % |
| Gross | 38.78 % | 28.07 % | 22.24 % |
| R&D to Revenue | 10.44 % | 15.04 % | 15.76 % |
Despite improvements in 2025, profitability ratios were notably weak in prior years due to substantial operating losses.
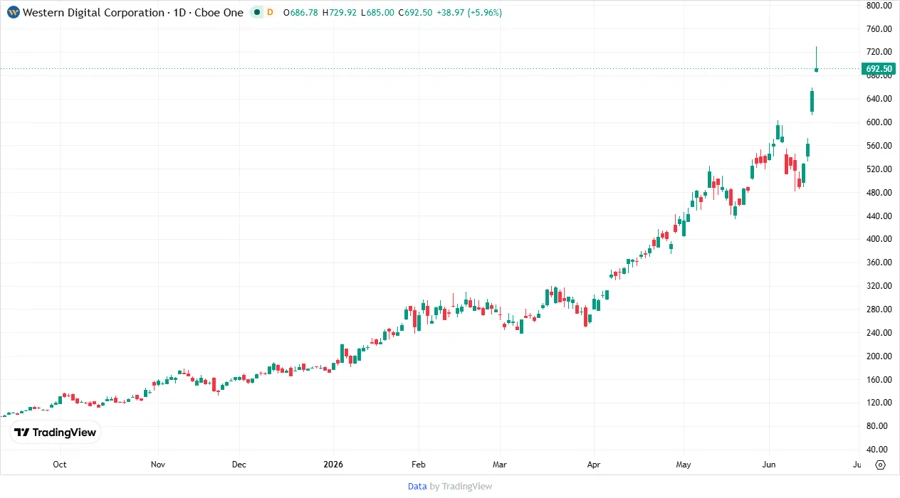
📈 Price Development
Dividend Scoring System
| Criteria | Score | |
|---|---|---|
| Dividend yield | 2 | |
| Dividend Stability | 2 | |
| Dividend growth | 1 | |
| Payout ratio | 3 | |
| Financial stability | 2 | |
| Dividend continuity | 3 | |
| Cashflow Coverage | 2 | |
| Balance Sheet Quality | 2 |
Total Score: 17/40
✅ Rating
Western Digital Corporation displays a modest dividend profile with significant challenges in maintaining growth and stability. Investors should weigh the potential risk of dividend cuts given the current financial metrics, and approach this investment with caution amid ongoing profitability concerns.
Smart Data Insight
Master the Perfect Entry & Exit for this Stock
Don't leave your profits to chance. Historically, this stock follows specific seasonal patterns that institutional traders use to maximize returns.
- ✅ Identify the "Golden Buying Window"
- ✅ Avoid high-risk correction cycles
- ✅ Backtested data from the last 20+ years