April 29, 2026 a 07:31 am

WDC: Dividend Analysis - Western Digital Corporation
Western Digital Corporation, a prominent player in the technology sector, has maintained a modest dividend yield amidst evolving market conditions. Their historical ability to generate consistent dividends over 11 years exemplifies resilience in a competitive market. With recent shifts in policy, their current focus appears to balance investor returns and internal reinvestment strategies.
📊 Overview
The Western Digital Corporation operates principally within the technology sector. With a dividend yield of 0.17%, the firm delivers $0.126 per share in dividends, backed by an 11-year history of payments. Their strategic continuance in dividend issuance, without recent cuts or suspensions, indicates a cautious yet stable financial approach.
| Sector | Dividend Yield | Current Dividend per Share | Dividend History | Last Cut or Suspension |
|---|---|---|---|---|
| Technology | 0.17% | 0.127 USD | 11 years | None |
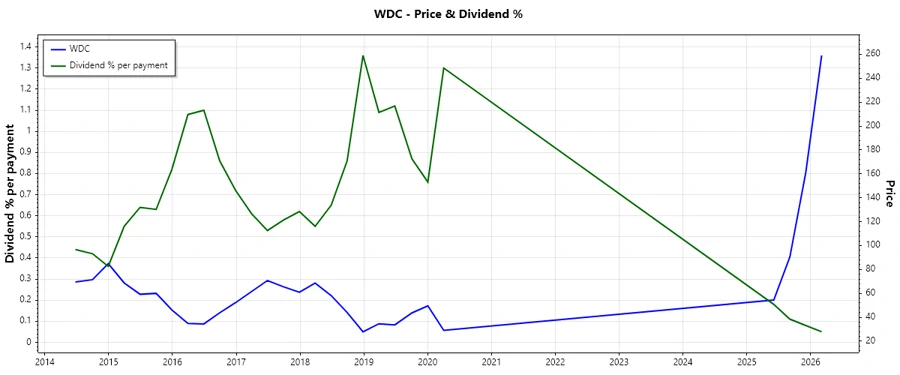
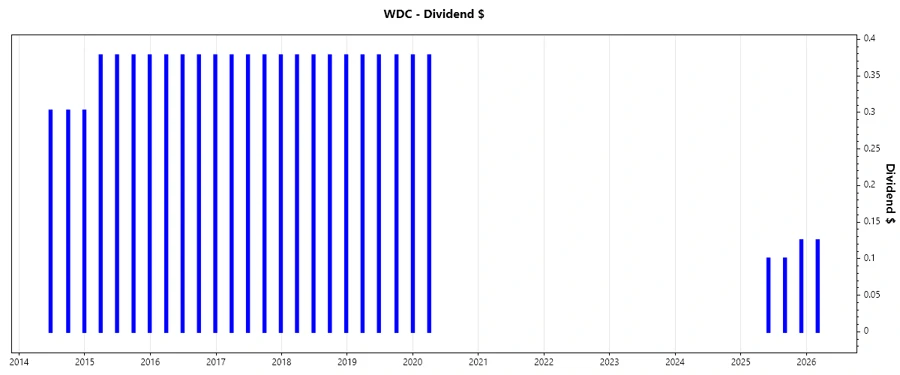
📉 Dividend History
An examination of Western Digital's dividend history offers insight into their capacity to sustain shareholder returns through varying economic phases. A stable past dividend payout signals strength, fostering investor confidence and appealing to conservative income investors.
| Year | Dividend per Share (USD) |
|---|---|
| 2026 | 0.125 |
| 2025 | 0.325 |
| 2020 | 0.75562 |
| 2019 | 1.13343 |
| 2018 | 1.51124 |
📈 Dividend Growth
Western Digital's recent dividend growth rates highlight the impact of strategic fiscal management. Notably, the 3-year and 5-year growth perspectives offer a crucial view of potential long-term returns during fluctuating market environments.
| Time | Growth |
|---|---|
| 3 years | -24.51% |
| 5 years | -15.53% |
The average dividend growth is -15.53% over 5 years. This shows declining returns, pointing towards a strategic reinvestment or cost management approach, possibly impacting newer dividend entries.
🗣️ Payout Ratio
The payout ratio provides critical insights into how much of Western Digital's earnings are being returned to shareholders, directly reflecting on sustainability and future growth capacity.
| Key Figure | Ratio |
|---|---|
| EPS-based | 114.97% |
| Free Cash Flow-based | 186.43% |
With an EPS-based payout of 114.97% and FCF-based at 186.43%, these robust figures suggest pressures on earnings to support dividend sustainability, highlighting potential risk if earnings do not increase.
Cashflow & Capital Efficiency
Cash flow metrics paint a vital picture of Western Digital's operational efficiency and capability to support capital expenditures and shareholder returns without impacting future growth.
| Year/Metric | 2025 | 2024 | 2023 |
|---|---|---|---|
| Free Cash Flow Yield | 5.85% | -4.18% | -13.33% |
| Earnings Yield | 8.47% | -4.28% | -18.48% |
| CAPEX to Operating Cash Flow | 24.07% | -165.65% | -197.79% |
| Stock-based Compensation to Revenue | 2.78% | 4.67% | 5.08% |
| Free Cash Flow / Operating Cash Flow Ratio | 75.93% | 265.65% | 297.79% |
| Return on Invested Capital | 21.53% | -2.03% | -2.69% |
The declining free cash flow yield and rising CAPEX ratios signal increased reliance on investment funding, indicating a shift towards internal growth yet raising potential risks in capital distribution efficiency.
Balance Sheet & Leverage Analysis
Western Digital's liquidity and leverage ratios deliver insights into financial stability, offering a framework for evaluating the company's potential for handling debt and sustaining growth without over-leveraging itself.
| Year/Metric | 2025 | 2024 | 2023 |
|---|---|---|---|
| Debt-to-Equity | 95.67% | 72.32% | 77.29% |
| Debt-to-Assets | 36.29% | 32.35% | 34.52% |
| Debt-to-Capital | 48.89% | 41.97% | 43.60% |
| Net Debt to EBITDA | 1.53 | 25.81 | 22.32 |
| Current Ratio | 1.08 | 1.32 | 1.45 |
| Quick Ratio | 0.84 | 1.10 | 0.77 |
| Financial Leverage | 2.64 | 2.24 | 2.23 |
Stable liquidity ratios indicate moderate capacity to meet financial obligations. However, increased net debt ratios denote potential challenges in scaling, warranting prudent financial management.
Fundamental Strength & Profitability
Performance metrics provide a sharp lens into Western Digital's capacity to yield profits and invest in growth ventures, forming the backbone of their capital and operational effectiveness strategies.
| Year/Metric | 2025 | 2024 | 2023 |
|---|---|---|---|
| Return on Equity | 35.04% | -7.38% | -15.36% |
| Return on Assets | 13.29% | -3.30% | -6.86% |
| Margins: Net | 19.55% | -12.63% | -26.92% |
| EBIT | 15.62% | -5.14% | -8.62% |
| EBITDA | 20.36% | 3.85% | 4.62% |
| Gross | 38.78% | 28.07% | 22.24% |
| R&D to Revenue | 10.15% | 15.04% | 15.76% |
The fluctuating return on equity and negative margins speak to challenges in profitability, indicating operational inefficiencies or strategic pivot needs.
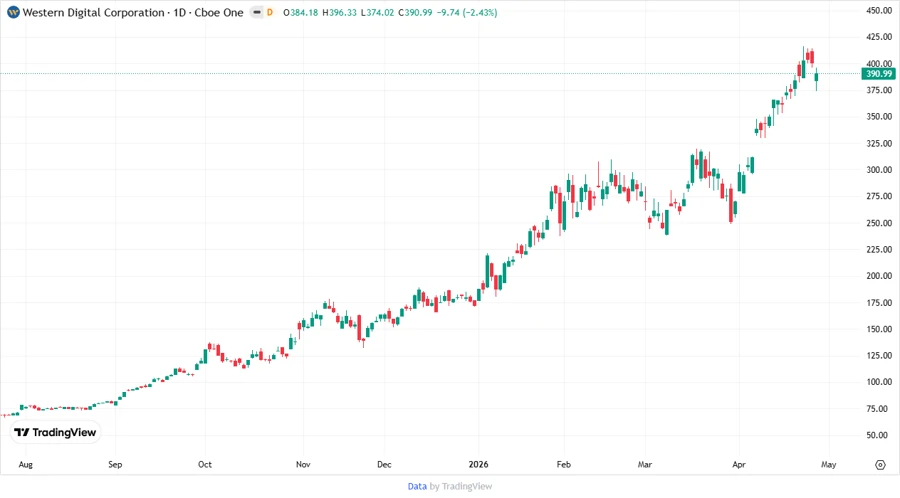
Price Development
Dividend Scoring System
| Criteria | Score | Scaled Score |
|---|---|---|
| Dividend Yield | 2 | |
| Dividend Stability | 3 | |
| Dividend Growth | 1 | |
| Payout Ratio | 2 | |
| Financial Stability | 3 | |
| Dividend Continuity | 4 | |
| Cashflow Coverage | 3 | |
| Balance Sheet Quality | 3 |
Total Score: 21/40
✅ Rating
Western Digital Corporation exhibits a moderate dividend profile marked by basic stability but challenged growth. While the historical commitment to payments is notable, the current financial metrics advise a conservative outlook, encouraging potential investors to weigh short-term risks against potential long-term returns carefully.
Smart Data Insight
Master the Perfect Entry & Exit for this Stock
Don't leave your profits to chance. Historically, this stock follows specific seasonal patterns that institutional traders use to maximize returns.
- ✅ Identify the "Golden Buying Window"
- ✅ Avoid high-risk correction cycles
- ✅ Backtested data from the last 20+ years