October 17, 2025 a 07:31 am

WDC: Dividend Analysis - Western Digital Corporation
Western Digital Corporation, a key player in the data storage industry, presents a moderately competitive dividend profile amidst mixed financial indicators. Noted for its 10-year dividend history, the company's recent track record shows a notable decrease in dividends and yield. With strategic attention on further enhancing profitability and financial management, stakeholders may anticipate better alignment of dividends with earnings and cash flow stability.
📊 Overview
The following table provides an actionable summary of Western Digital Corporation's key dividend metrics, crucial for tracking its ongoing performance and shareholder return strategy.
| Attribute | Value |
|---|---|
| Sector | Technology |
| Dividend yield | 0.22% |
| Current dividend per share | 0.127 USD |
| Dividend history | 10 years |
| Last cut or suspension | None |
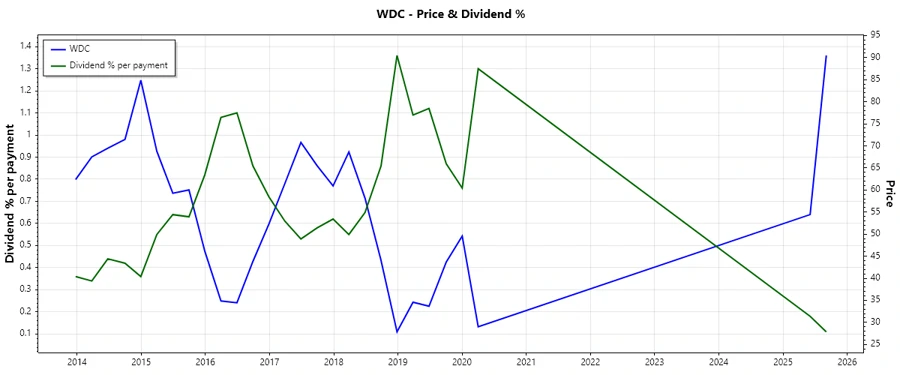
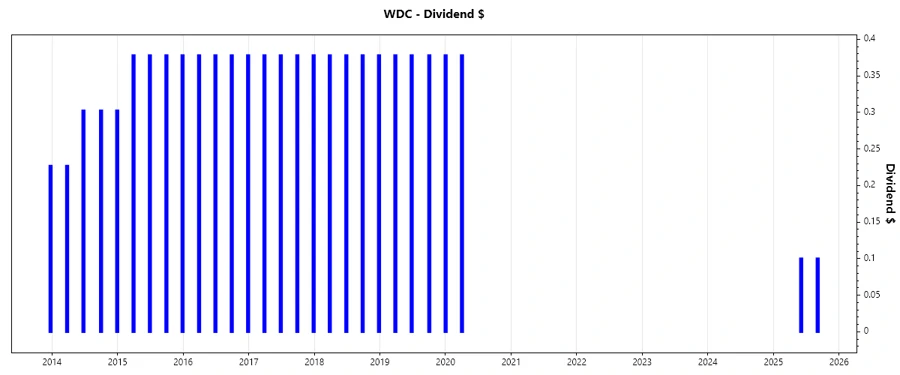
🗣️ Dividend History
The dividend history offers valuable insights into Western Digital's payout trends and financial priorities, essential for assessing long-term income potential.
| Year | Dividend Per Share (USD) |
|---|---|
| 2025 | 0.20 |
| 2020 | 0.76 |
| 2019 | 1.13 |
| 2018 | 1.51 |
| 2017 | 1.51 |
📈 Dividend Growth
Evaluating dividend growth over set periods provides a clearer picture of sustainability and increases in shareholder value, crucial for long-term investors.
| Time | Growth |
|---|---|
| 3 years | 0% |
| 5 years | -7.79% |
The average dividend growth is -7.79% over 5 years. This shows moderate but declining dividend growth.
📰 Payout Ratio
The payout ratio is crucial for understanding dividend sustainability. A higher ratio can signal potential issues if earnings decline.
| Key figure | Ratio |
|---|---|
| EPS-based | 2.36% |
| Free cash flow-based | 3.44% |
With an EPS-based payout ratio of 2.36% and a free cash flow-based ratio of 3.44%, Western Digital exhibits a conservative approach, allowing flexibility for reinvestment and debt management.
🧮 Cashflow & Capital Efficiency
Evaluating cash flow efficiency and capital utilization underscores a company’s capacity to fund dividends, operations, and growth in a sustainable manner.
| Year | 2025 | 2024 | 2023 |
|---|---|---|---|
| Free Cash Flow Yield | 5.85% | -4.18% | -13.33% |
| Earnings Yield | 8.47% | -4.28% | -18.48% |
| CAPEX to Operating Cash Flow | 24.07% | -165.65% | -197.79% |
| Stock-based Compensation to Revenue | 2.78% | 4.67% | 5.08% |
| Free Cash Flow / Operating Cash Flow Ratio | 75.93% | 265.65% | 297.79% |
Western Digital's cash flow indicators suggest challenges with maintaining a sustainably positive cash position, further impacted by high capital expenditures relative to cash flow.
🧾 Balance Sheet & Leverage Analysis
Leverage metrics are key to gauging financial risk and stability, impacting a company's capacity to generate shareholder value.
| Year | 2025 | 2024 | 2023 |
|---|---|---|---|
| Debt-to-Equity | 0.85 | 0.67 | 0.60 |
| Debt-to-Assets | 0.34 | 0.31 | 0.29 |
| Debt-to-Capital | 0.46 | 0.40 | 0.37 |
| Net Debt to EBITDA | 1.34 | 24.21 | 17.46 |
| Current Ratio | - | - | - |
| Quick Ratio | 0.84 | 1.10 | 0.77 |
| Financial Leverage | 2.53 | 2.19 | 2.07 |
Western Digital's leverage ratios indicate a considerable level of debt, with inconsistent EBITDA coverage, suggesting potential financial constraints unless further equity support is ensured.
🔥 Fundamental Strength & Profitability
Profitability metrics such as return on equity and asset margins reflect the overall financial health and efficiency in creating value for shareholders.
| Year | 2025 | 2024 | 2023 |
|---|---|---|---|
| Return on Equity | 33.59% | -7.22% | -14.23% |
| Return on Assets | 13.29% | -3.30% | -6.86% |
| Margins: Net | 19.55% | -12.63% | -26.92% |
| EBIT Margin | 15.62% | -5.14% | -8.62% |
| EBITDA Margin | 20.36% | 3.85% | 4.62% |
| Gross Margin | 38.78% | 28.07% | 22.24% |
| R&D to Revenue | 10.44% | 15.04% | 15.76% |
Despite fluctuations in profitability, efforts in research and development are commendable, indicating a strategic priority towards innovation and future growth.
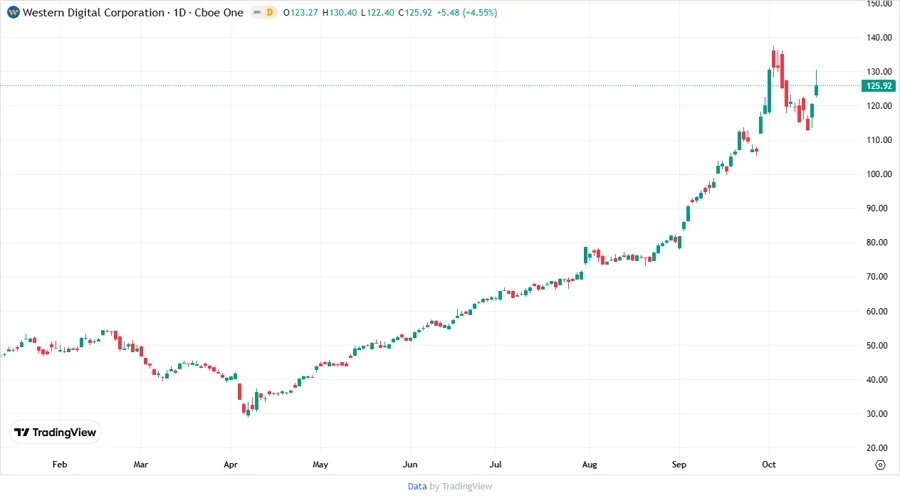
🤑 Price Development
🌟 Dividend Scoring System
| Category | Score (1-5) | Score Bar |
|---|---|---|
| Dividend yield | 2 | |
| Dividend Stability | 2 | |
| Dividend growth | 1 | |
| Payout ratio | 4 | |
| Financial stability | 3 | |
| Dividend continuity | 2 | |
| Cashflow Coverage | 3 | |
| Balance Sheet Quality | 3 |
Overall Score: 20/40
💬 Rating
Western Digital's dividend profile presently exhibits limited potential with mixed financial results and substantial debt levels. With speculative growth in dividends and profitability needing improvement, continued monitoring is advised for risk mitigation.
Smart Data Insight
Master the Perfect Entry & Exit for this Stock
Don't leave your profits to chance. Historically, this stock follows specific seasonal patterns that institutional traders use to maximize returns.
- ✅ Identify the "Golden Buying Window"
- ✅ Avoid high-risk correction cycles
- ✅ Backtested data from the last 20+ years