June 16, 2025 a 03:31 am

WDC: Dividend Analysis - Western Digital Corporation
Western Digital Corporation (WDC) is a data storage pioneer with a focus on innovation and technology. Despite its current lack of dividends, WDC’s historical commitment to shareholder returns remains apparent. Their current financial posture indicates priority towards reinvestment and growth over immediate shareholder distribution.
📊 Overview
Western Digital Corporation is a pivotal player in the data technology industry, operating within the volatile and highly competitive Technology sector. Despite its current suspension of dividend payments, the company has a 10-year dividend history, demonstrating prior strength in shareholder value distribution.
| Sector | Dividend Yield | Current Dividend per Share | Dividend History | Last Cut or Suspension |
|---|---|---|---|---|
| Technology | 0.18% | $0.00 | 10 years | None |
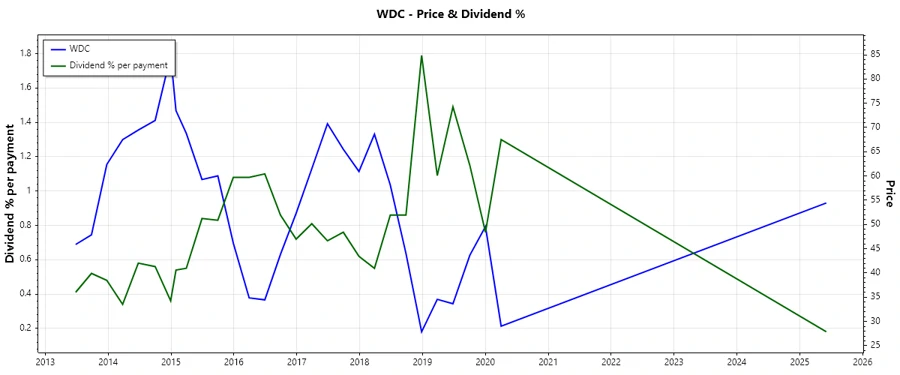
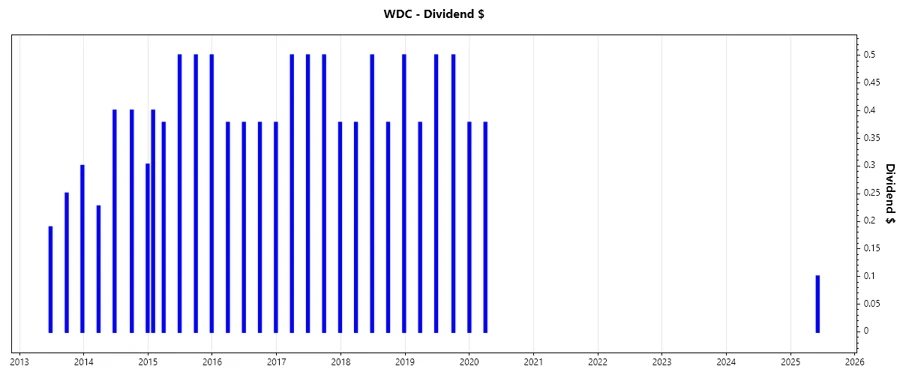
🗣️ Dividend History
Analyzing historical dividend data provides critical insights into a company's commitment to returning value to its shareholders. For WDC, the historical dividends reflect fluctuations typical of an evolving enterprise within a tech-driven market.
| Year | Dividend per Share |
|---|---|
| 2025 | $0.10 |
| 2020 | $0.76 |
| 2019 | $1.38 |
| 2018 | $1.76 |
| 2017 | $1.88 |
📈 Dividend Growth
Dividend growth is a testament to a company's capacity to enhance shareholder value over time. WDC has shown negative growth over both 3 and 5 years, which reflects its strategic pivot towards strengthening its financial footing amidst industry pressure.
| Time | Growth |
|---|---|
| 3 years | 0% |
| 5 years | -11.32% |
The average dividend growth is -11.32% over 5 years. This shows a strategic reevaluation of resources towards internal growth and stability prospects, rather than dividend expansion.
📉 Payout Ratio
The payout ratio is a crucial measure for understanding how much of a company’s earnings are returned to shareholders as dividends. Current figures show a pause in payouts, highlighting a strategic reinvestment within WDC.
| Key Figure | Ratio |
|---|---|
| EPS-based | 0% |
| Free cash flow-based | 0% |
WDC’s current 0% payout ratio signifies a deliberate strategy to conserve cash and invest in future growth opportunities, rather than immediate shareholder distributions.
✅ Cashflow & Capital Efficiency
Cashflow stability and capital efficiency are pivotal for potential reinvestment and debt servicing capabilities.
| Metric | 2024 | 2023 | 2022 |
|---|---|---|---|
| Free Cash Flow Yield | -4.18% | -13.33% | 7.55% |
| Earnings Yield | -4.28% | -18.72% | 15.10% |
| CAPEX to Operating Cash Flow | -165.65% | -197.79% | 58.88% |
| Stock Compensation to Revenue | 2.30% | 2.58% | 1.73% |
| FCF / Operating Cash Flow Ratio | 265.65% | 297.79% | 41.12% |
WDC shows variegated cash flow positioning, marked by compromised yields in recent years, emphasizing the need for balancing reinvestment and operational liquidity.
⚠️ Balance Sheet & Leverage Analysis
Effectively managing debt and maintaining leverage is essential for both liquidity and long-term solvency.
| Metric | 2024 | 2023 | 2022 |
|---|---|---|---|
| Debt-to-Equity | 0.6872 | 0.6518 | 0.5746 |
| Debt-to-Assets | 0.3073 | 0.2894 | 0.2674 |
| Debt-to-Capital | 0.4073 | 0.3946 | 0.3649 |
| Net Debt to EBITDA | 17.15 | -12.62 | 1.31 |
| Current Ratio | 0 | 0 | 2.07 |
| Quick Ratio | 0.7751 | 0.7707 | 1.2761 |
| Financial Leverage | 2.24 | 2.25 | 2.15 |
While WDC’s leverage and capital positions present a robust base, recent deterioration points to an emphasis on credit restructuring and capital management.
🔍 Fundamental Strength & Profitability
The ability to generate returns and maintain profitability margins is a gauge of internal efficiency and external competitiveness.
| Metric | 2024 | 2023 | 2022 |
|---|---|---|---|
| Return on Equity | -7.38% | -15.73% | 12.65% |
| Return on Assets | -3.30% | -6.98% | 5.89% |
| Net Margin | -6.14% | -13.85% | 8.23% |
| EBIT Margin | -1.88% | -10.05% | 13.17% |
| EBITDA Margin | 2.49% | -3.25% | 19.13% |
| Gross Margin | 22.65% | 15.32% | 31.26% |
| R&D to Revenue | 14.67% | 16.31% | 12.36% |
WDC’s profitability metrics underscore cycles of technological evolution and the higher costs of innovation adoption within the tech space.
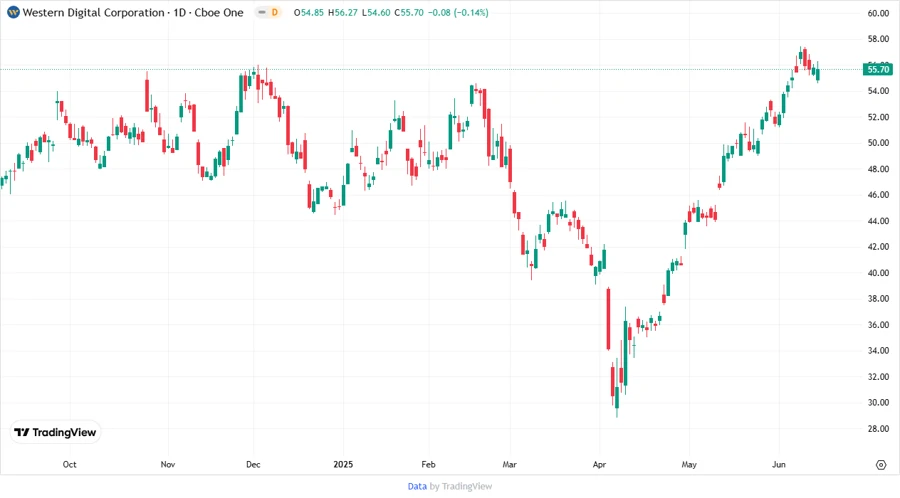
📸 Price Development
🏅 Dividend Scoring System
| Criterion | Score | |
|---|---|---|
| Dividend Yield | 1 | |
| Dividend Stability | 2 | |
| Dividend Growth | 1 | |
| Payout Ratio | 1 | |
| Financial Stability | 3 | |
| Dividend Continuity | 2 | |
| Cashflow Coverage | 2 | |
| Balance Sheet Quality | 3 |
Total Score: 15/40
🔖 Rating
Western Digital Corporation's current financial metrics reveal a strategic pause in dividends with a focus on fortifying its foundational technologies and market position. While historic payouts exemplify previous strong shareholder value emphasis, present dynamics suggest caution and patience for potential investors seeking immediate returns. The firm's approach towards debt management, reinvestment, and operational excellence aims to secure its future competitive standing. As such, WDC is a speculative investment for those with an appetite for growth potential amidst technological volatility.
Smart Data Insight
Master the Perfect Entry & Exit for this Stock
Don't leave your profits to chance. Historically, this stock follows specific seasonal patterns that institutional traders use to maximize returns.
- ✅ Identify the "Golden Buying Window"
- ✅ Avoid high-risk correction cycles
- ✅ Backtested data from the last 20+ years