April 13, 2026 a 06:44 am
WDAY: Fibonacci Analysis - Workday, Inc.
Workday, Inc. operates in a competitive cloud application sector, particularly focusing on human capital and financial management solutions. Recently, the company's shares have been trending downward, reflecting challenges in maintaining growth momentum. Despite market volatility, Workday continues to innovate within its Enterprise Resource Planning (ERP) offerings, which could provide future growth opportunities. Investors should be cautious, as recent price movements might affect short-term profitability.
Fibonacci Analysis
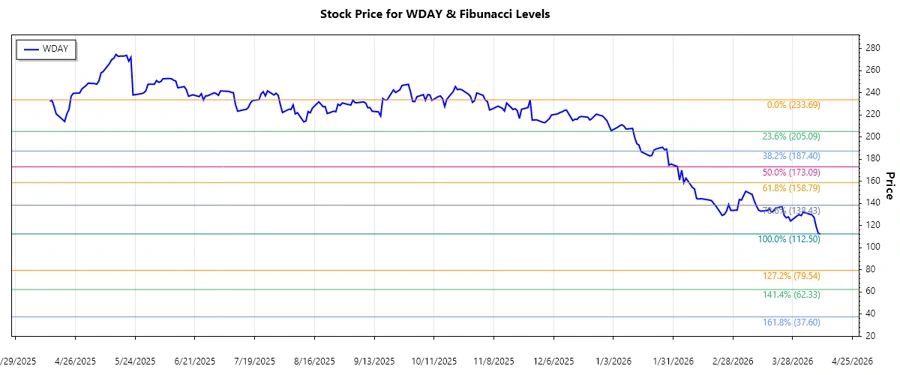
The recent data suggests a prominent downtrend in Workday, Inc.'s stock price. Using the highest point of $233.69 on 2025-11-25 and the lowest point of $112.5 on 2026-04-10, we compute the Fibonacci retracement levels. These levels can indicate potential support and resistance areas.
| Trend Date Range | High (USD, Date) | Low (USD, Date) |
|---|---|---|
| 2025-11-25 to 2026-04-10 | $233.69, 2025-11-25 | $112.5, 2026-04-10 |
| Fibonacci Level | Price (USD) |
|---|---|
| 0.236 | $145.49 |
| 0.382 | $157.81 |
| 0.5 | $173.09 |
| 0.618 | $188.37 |
| 0.786 | $211.33 |
The current price of $112.5 is not within any Fibonacci retracement levels, indicating further downside potential before a possible reversal. If the price ascends into a retracement zone, it could indicate potential support or resistance.
Conclusion
The analysis of Workday, Inc.'s stock shows a significant downtrend over recent months. Fundamental pressures in the cloud application market are being reflected in the declining stock value. The Fibonacci retracement levels reveal that the stock may encounter critical support at lower levels. However, if the stock starts climbing, these levels may act as resistance. Analysts should monitor market developments closely to assess when a reversal may begin, bearing in mind both the risks of continued declines and opportunities in market stabilization.