December 08, 2025 a 06:44 am

WDAY: Fibonacci Analysis - Workday, Inc.
Workday, Inc. has shown a notable downtrend in recent months. The company's focus on enterprise cloud applications provides solid growth opportunities. However, the recent decline in stock price highlights vulnerabilities in their market performance amidst stiff competition.
Fibonacci Analysis
| Detail | Value |
|---|---|
| Trend Start Date | 2024-12-09 |
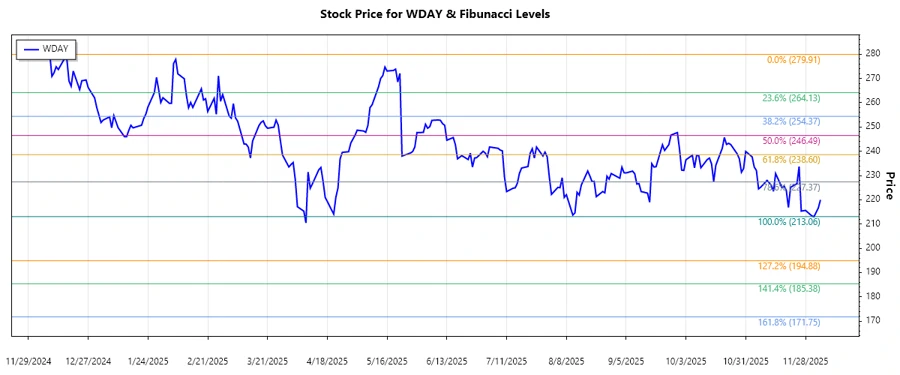
| Trend End Date | 2025-12-05 |
| High Point | $279.91 on 2024-12-09 |
| Low Point | $213.06 on 2025-12-02 |
Fibonacci Levels
| Fibonacci Level | Price |
|---|---|
| 0.236 | 232.05 |
| 0.382 | 240.76 |
| 0.5 | 246.48 |
| 0.618 | 252.19 |
| 0.786 | 261.48 |
The current price of $219.96 is below the 0.236 Fib level, indicating it's not currently in a retracement zone. This position suggests potential resistance should the price rise, with support near the recent low.
Conclusion
Workday, Inc. has encountered a bearish trend throughout the year, illustrating significant challenges despite a stable market presence. The stock is currently below the 0.236 retracement level, indicating ongoing weakness. For investors, this could represent a buying opportunity if they anticipate a reversal or indicate caution due to possible further declines. Analysts should pay attention to key support levels to predict potential reversal points or further dips.