February 25, 2026 a 04:03 am
WBD: Trend and Support & Resistance Analysis - Warner Bros. Discovery, Inc.
Warner Bros. Discovery, Inc. (Ticker: WBD) has been navigating a dynamic market landscape. The recent data shows a complex interaction between media and entertainment sector trends, influencing the company’s stock movement. Investors are advised to keep an eye on the technical indicators for potential entry and exit points. The analysis below highlights key support and resistance zones, as well as trend dynamics, which are crucial for informed decision-making.
Trend Analysis
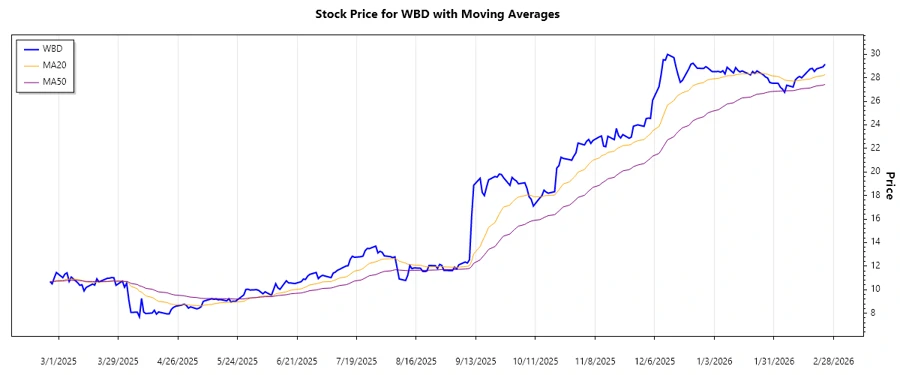
Analyzing the historical data reveals a recent period of consistent price elevation, signaling a dominant uptrend. Utilization of the 20-day and 50-day Exponential Moving Averages (EMAs) offers insight into momentum shifts:
| Date | Close Price | Trend |
|---|---|---|
| 2026-02-24 | $29.15 | ▲ Uptrend |
| 2026-02-23 | $28.92 | ▲ Uptrend |
| 2026-02-20 | $28.75 | ▲ Uptrend |
| 2026-02-19 | $28.53 | ▲ Uptrend |
| 2026-02-18 | $28.79 | ▲ Uptrend |
| 2026-02-17 | $28.75 | ▲ Uptrend |
| 2026-02-13 | $27.99 | ▲ Uptrend |
The current trend, assisted by the EMA20 being higher than EMA50, suggests a positive momentum: ▲ Upward Trends are prevalent. This technical state indicates potential profit-taking opportunities for short to medium-term investors.
Support and Resistance
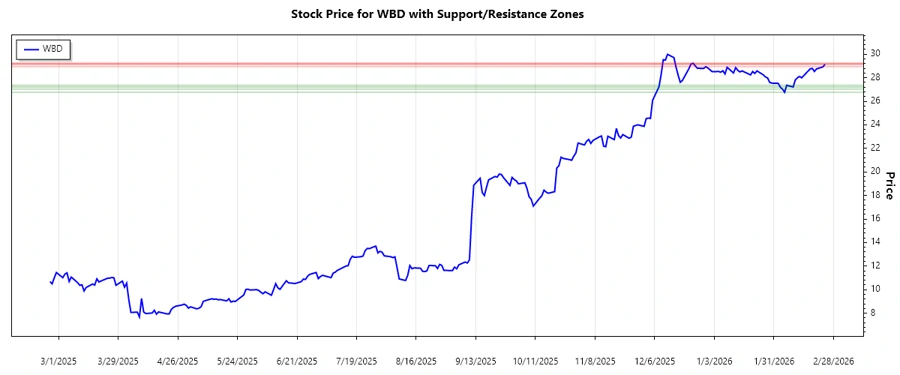
Based on the recent closing prices, the following support and resistance levels have been identified:
| Zone | From | To |
|---|---|---|
| Support Zone 1 | $27.21 | $27.36 |
| Support Zone 2 | $26.76 | $27.03 |
| Resistance Zone 1 | $29.15 | $29.23 |
| Resistance Zone 2 | $28.94 | $29.15 |
The stock is currently trading near its resistance level, suggesting a challenge to break this ceiling. If broken, further upward movement is anticipated. Conversely, the support zones provide buying opportunities.
Conclusion
Warner Bros. Discovery, Inc.'s recent upward trend offers promising opportunities for investment, driven by strong technical indicators. Potential breakouts above the resistance zones could yield significant gains. However, the presence of clear support levels also provides a safety net for downside protection. Monitoring these zones is crucial for investors aiming to optimize their strategy, balancing the risks of volatility with potential lucrative returns.