
July 16, 2026 a 05:15 am
WBD: Fibonacci Analysis - Warner Bros. Discovery, Inc.
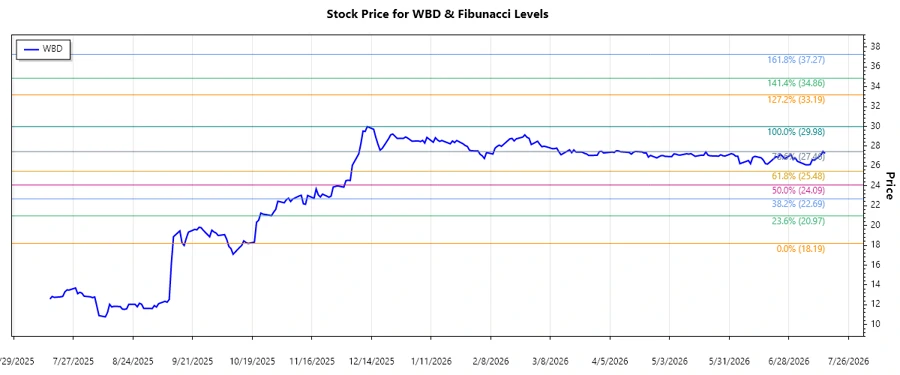
The stock of Warner Bros. Discovery, Inc. has shown considerable volatility over recent months. Investors have been closely monitoring the company's strategies in media and entertainment as these significantly influence their market performance. This analysis focuses on the company's recent trend to determine potential investment opportunities.
Fibonacci Analysis
| Details | Data |
|---|---|
| Trend Type | Up |
| Start Date | 2025-11-24 |
| End Date | 2026-07-15 |
| High Point | $29.98 on 2025-12-12 |
| Low Point | $18.19 on 2025-10-17 |
| Fibonacci Levels |
|
| Current Price Level | Close to 0.5 Retracement Level |
| Technical Interpretation | The current stock price is fluctuating around the 0.5 retracement level, which can act as a strong support or resistance point. |
Conclusion
The stock of Warner Bros. Discovery, Inc. is currently experiencing a period of consolidation after a notable upward trend. This retracement indicates a potential opportunity for investors to buy, especially if the price holds at the 0.5 Fibonacci retracement level. However, if the price support fails, further declines may be anticipated. Given the company's diverse media portfolio and strategic initiatives, investors can expect significant future movements. Overall, while there are growth prospects, some caution is advised due to existing market risks.
Smart Data Insight
Master the Perfect Entry & Exit for this Stock
Don't leave your profits to chance. Historically, this stock follows specific seasonal patterns that institutional traders use to maximize returns.
- ✅ Identify the "Golden Buying Window"
- ✅ Avoid high-risk correction cycles
- ✅ Backtested data from the last 20+ years