
May 26, 2026 a 05:15 am
WAT: Fibonacci Analysis - Waters Corporation
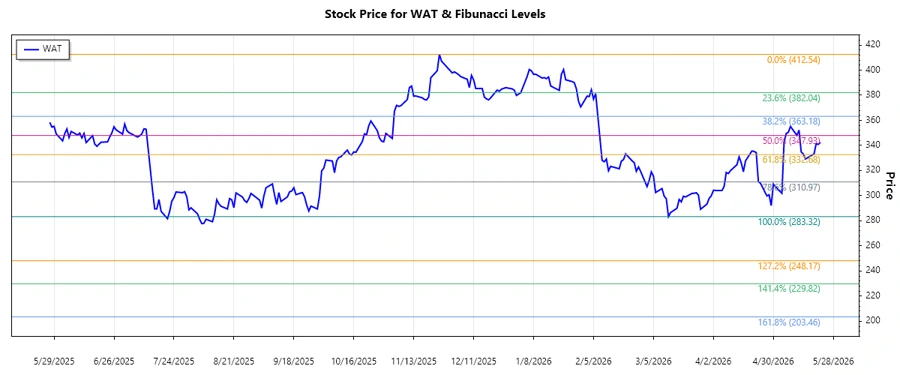
The Waters Corporation stock has demonstrated significant volatility over recent months. However, a definitive downtrend is now observable, characterized by a steady decline in prices. Investors should approach this stock cautiously, as the recent trend suggests potential challenges ahead. Careful attention should be paid to technical levels, potentially providing opportunities for future price action reversals.
Fibonacci Analysis
| Detail | Information |
|---|---|
| Start Date | 2025-11-25 |
| End Date | 2026-05-22 |
| High Point | $412.54 on 2025-11-25 |
| Low Point | $283.32 on 2026-03-12 |
Fibonacci Retracement Levels
| Level | Price |
|---|---|
| 0.236 | $329.78 |
| 0.382 | $344.37 |
| 0.5 | $347.93 |
| 0.618 | $360.42 |
| 0.786 | $397.53 |
The current price is $342.37, which places it in the 0.236 retracement zone. This suggests the potential for support at this level, but a breach could indicate further downside potential.
The current technical setup emphasizes the importance of the 0.236 Fibonacci level as a critical support zone. If prices extend below this point, we may witness further bearish momentum.
Conclusion
In summary, Waters Corporation is in the midst of a pronounced downtrend, having faced significant downward pressure since November 2025. The Fibonacci retracement levels offer crucial insights, with the stock currently finding support around the 0.236 level. For investors, the immediate challenge lies in assessing whether this support will hold or be overridden by amplified bearish sentiment. The levels further above, particularly 0.382 and 0.5, could potentially act as resistance should the stock attempt to rebound. Caution is advised, as the current market sentiment leans bearish, with risks of further declines if key support levels don't hold.
Smart Data Insight
Master the Perfect Entry & Exit for this Stock
Don't leave your profits to chance. Historically, this stock follows specific seasonal patterns that institutional traders use to maximize returns.
- ✅ Identify the "Golden Buying Window"
- ✅ Avoid high-risk correction cycles
- ✅ Backtested data from the last 20+ years