September 03, 2025 a 08:15 am

WAB: Trend and Support & Resistance Analysis - Westinghouse Air Brake Technologies Corporation
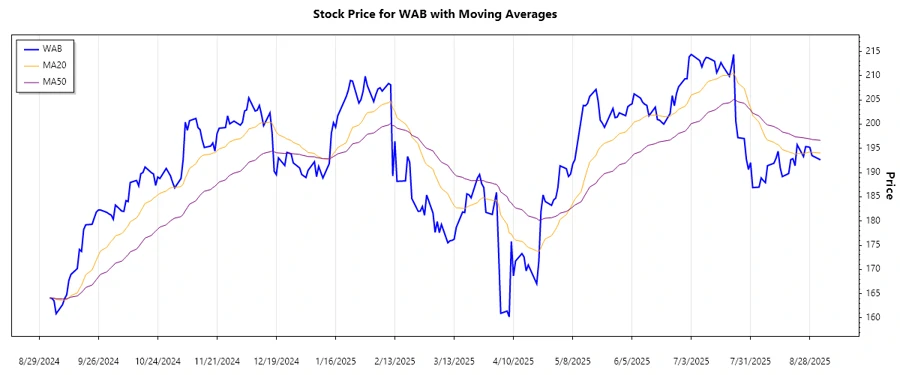
The recent trend analysis for WAB indicates a marginal downtrend over the prior months. The stock has shown some volatility, influenced by sectoral trends in the freight and transit industries globally. Investors should observe for upcoming catalysts that may impact company performance, including technology developments or rail infrastructure investments.
Trend Analysis
Reviewing the historical data and examining short to long-term moving averages indicates a recent decline. The EMA20 has remained consistently below the EMA50, reinforcing the current bearish sentiment evident in recent weeks.
| Date | Closing Price | Trend |
|---|---|---|
| 2025-09-02 | 192.62 | ▼ |
| 2025-08-29 | 193.50 | ▼ |
| 2025-08-28 | 195.18 | ▼ |
| 2025-08-27 | 195.32 | ▼ |
| 2025-08-26 | 195.34 | ▼ |
| 2025-08-25 | 193.31 | ▼ |
| 2025-08-22 | 195.74 | ▼ |
The stock's current movement in the downtrend is reconfirmed by the disparity between the EMA indicators.
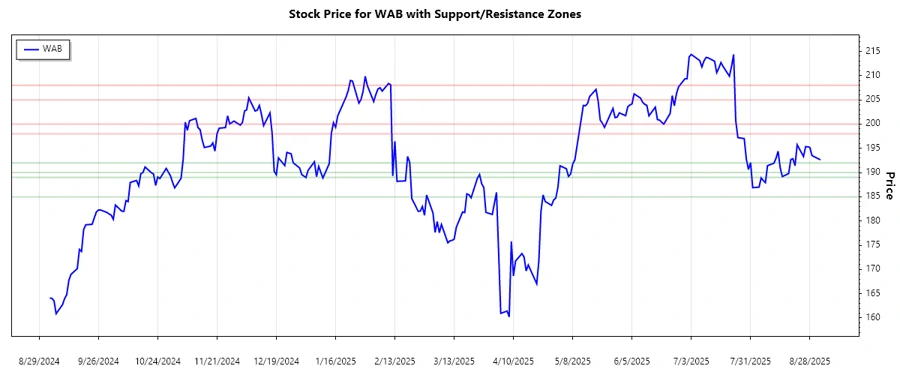
Support and Resistance
Based on daily closing prices, the following pivotal support and resistance zones were detected. These zones may provide short-term price barriers in the coming days:
| Zone Type | Range | Indication |
|---|---|---|
| Support Zone 1 | 190.00 - 192.00 | ▼ |
| Support Zone 2 | 185.00 - 189.00 | ▼ |
| Resistance Zone 1 | 198.00 - 200.00 | ▲ |
| Resistance Zone 2 | 205.00 - 208.00 | ▲ |
Currently, the stock is positioned near the lower end of the first support zone, which may act as a short-term floor barring significant market movements.
Conclusion
WAB's current technical indicators suggest pending bearish pressures, with critical support zones potentially buffering further declines. However, recent price fluctuations highlight the need for vigilance regarding sector advancements. Analysts should assess long-term support efficacy and evaluate the sustainability of detected resistance areas.
Smart Data Insight
Master the Perfect Entry & Exit for this Stock
Don't leave your profits to chance. Historically, this stock follows specific seasonal patterns that institutional traders use to maximize returns.
- ✅ Identify the "Golden Buying Window"
- ✅ Avoid high-risk correction cycles
- ✅ Backtested data from the last 20+ years