March 11, 2026 a 02:46 am

WAB: Dividend Analysis - Westinghouse Air Brake Technologies Corporation
Westinghouse Air Brake Technologies Corporation (WAB) has established itself as a consistent dividend payer with over 32 years of dividend history. With its current dividend yield of 0.41% and a moderate EPS payout ratio, it offers a stable, albeit modest, return for dividend-focused investors. Its low payout ratios and steady dividend growth over the years indicate a strong financial foundation to support future payouts. 🚂💸
📊 Overview
WAB operates in the Industrials sector, which is characterized by stable and cyclical growth modulations. Understanding the overall dividend performance can provide a glimpse into its capital allocation efficiency.
| Metric | Details |
|---|---|
| Sector | Industrials |
| Dividend Yield | 0.41% |
| Current Dividend Per Share | 1.01 USD |
| Dividend History | 32 years |
| Last Cut or Suspension | None |
🗣️ Dividend History
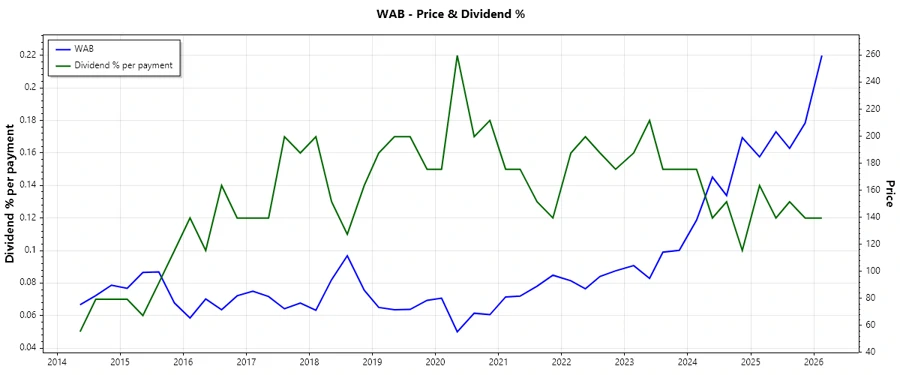
The comprehensive dividend history of WAB showcases its long-term commitment to rewarding shareholders. Over 32 years of regular payments reflect resilience and proactive financial management, crucial for dividend investors aiming for stability.
| Year | Dividend Per Share (USD) |
|---|---|
| 2026 | 0.31 |
| 2025 | 1.00 |
| 2024 | 0.80 |
| 2023 | 0.68 |
| 2022 | 0.60 |
📈 Dividend Growth
Dividend growth is pivotal in assessing a company's future income potential. With a 3-year growth rate of 18.56% and a 5-year growth rate of 15.81%, WAB has shown moderate escalations in dividend payouts, signifying its robust financial health and strategic growth management.
| Time | Growth |
|---|---|
| 3 years | 18.56% |
| 5 years | 15.81% |
The average dividend growth is 15.81% over 5 years. This shows moderate but steady dividend growth.
✅ Payout Ratio
Payout ratios offer insights into the sustainability of the dividend payout from both earnings and cash flow perspectives. A low ratio generally indicates a capacity for continued or increased payouts.
| Key Figure | Ratio |
|---|---|
| EPS-based | 14.77% |
| Free cash flow-based | 10.60% |
With an EPS-based payout ratio of 14.77% and a free cash flow payout ratio of 10.60%, WAB maintains a conservative approach, indicating ample room to sustain or increase dividends in the future.
💰 Cashflow & Capital Efficiency
These metrics reflect the company’s ability to efficiently allocate capital and generate consistent cash flows, which are crucial for supporting dividend payouts without eroding capital.
| Metric | 2025 | 2024 | 2023 |
|---|---|---|---|
| Free Cash Flow Yield | 4.12% | 4.93% | 4.47% |
| Earnings Yield | 3.21% | 3.20% | 3.59% |
| CAPEX to Operating Cash Flow | 14.78% | 11.29% | 15.49% |
| Stock-based Compensation to Revenue | 0.72% | 0.64% | 0.49% |
| Free Cash Flow / Operating Cash Flow Ratio | 85.22% | 88.71% | 84.51% |
The company's cash flow stability and capital efficiency metrics show effective management of operational resources, ensuring consistent returns.
📊 Balance Sheet & Leverage Analysis
A strong balance sheet with low leverage ratios can buffer against economic downturns, ensuring continuity in dividend payments.
| Metric | 2025 | 2024 | 2023 |
|---|---|---|---|
| Debt-to-Equity | 49.73% | 39.44% | 38.80% |
| Debt-to-Assets | 25.11% | 21.28% | 21.43% |
| Debt-to-Capital | 33.21% | 28.29% | 27.95% |
| Net Debt to EBITDA | 2.01 | 1.58 | 1.93 |
| Current Ratio | 1.10 | 1.30 | 1.20 |
| Quick Ratio | 0.57 | 0.69 | 0.63 |
| Financial Leverage | 1.98 | 1.85 | 1.81 |
The solid balance sheet with manageable leverage reflects financial prudence, empowering WAB to withstand fluctuations in the market.
🧩 Fundamental Strength & Profitability
Profitability ratios are central to understanding a company's operational success and its ability to continue dividend payments.
| Metric | 2025 | 2024 | 2023 |
|---|---|---|---|
| Return on Equity | 10.50% | 10.46% | 7.77% |
| Return on Assets | 5.30% | 5.65% | 4.29% |
| Net Profit Margin | 10.48% | 10.17% | 8.42% |
| EBIT Margin | 16.74% | 15.51% | 13.54% |
| EBITDA Margin | 21.22% | 19.93% | 18.47% |
| Gross Margin | 31.48% | 32.41% | 30.42% |
| Research & Development to Revenue | 2.00% | 2.00% | 2.25% |
The profitability measures indicate an efficient utilization of resources, providing a backdrop for solidifying dividend strategies.
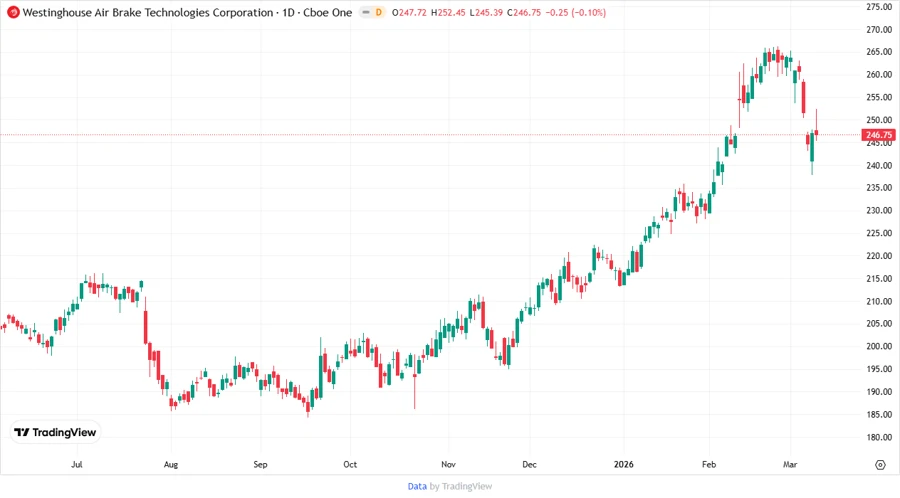
📉 Price Development
🔎 Dividend Scoring System
| Criteria | Score (out of 5) | Bar |
|---|---|---|
| Dividend yield | 3 | |
| Dividend Stability | 5 | |
| Dividend growth | 4 | |
| Payout ratio | 5 | |
| Financial stability | 4 | |
| Dividend continuity | 5 | |
| Cashflow Coverage | 4 | |
| Balance Sheet Quality | 4 |
Total Score: 34/40
🛡️ Rating
Westinghouse Air Brake Technologies Corporation exhibits exemplary dividend stability and growth potential, backed by a solid financial foundation. Its moderate but consistent dividend growth, coupled with strong payout ratios, sets it as a reliable option for income-focused investors. Maintaining an above-average financial health profile, WAB holds the potential to sustain and possibly enhance its dividend payouts, making it a commendable choice for investors seeking a blend of income and growth.