November 20, 2025 a 02:46 am

WAB: Dividend Analysis - Westinghouse Air Brake Technologies Corporation
Westinghouse Air Brake Technologies Corporation displays consistent commitment to shareholder returns through its dividends. With a solid history and moderate growth rates, its dividend profile is strategically poised to attract long-term investors seeking steady income. However, its relatively low dividend yield might not cater to high-yield-seeking investors, yet the sustained stability over three decades is indicative of strong business foundations. The absence of recent dividend cuts underscores resilience and disciplined financial management.
📊 Overview
The company operates within a sector with strong cash flow generation opportunities, providing a reliable foundation for its dividend policy. Westinghouse Air Brake Technologies Corporation offers a current dividend yield of 0.48%, indicating moderate shareholder return relative to the broader market. Its current dividend per share stands at $0.80, backed by a profound history of 31 consecutive years without any cuts or suspensions, showcasing a robust dividend strategy.
| Sector | Dividend Yield (%) | Current Dividend per Share (USD) | Dividend History (Years) | Last Cut or Suspension |
|---|---|---|---|---|
| Railroad Equipment Manufacturing | 0.48 | 0.80 | 31 | None |
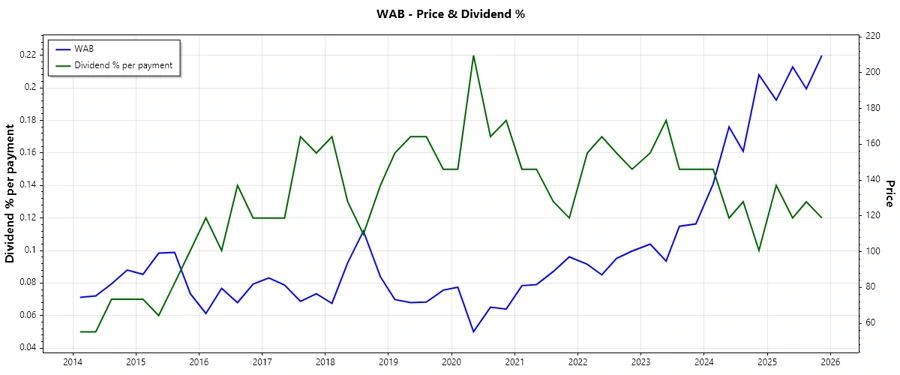
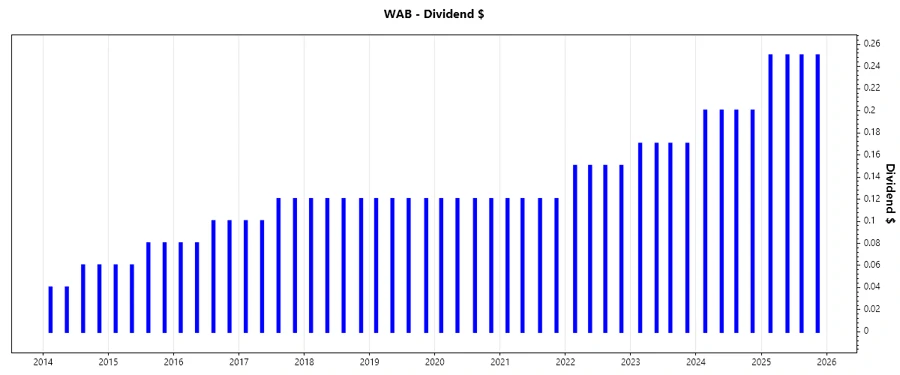
📈 Dividend History
The historical perspective of dividends is significant as it reflects the company’s commitment to its shareholders. Regular dividends over 31 years highlight financial health and investor focus. Westinghouse demonstrates stability by maintaining or increasing payouts, even across economic cycles.
| Year | Dividend per Share (USD) |
|---|---|
| 2025 | 1.00 |
| 2024 | 0.80 |
| 2023 | 0.68 |
| 2022 | 0.60 |
| 2021 | 0.48 |
📈 Dividend Growth
Understanding dividend growth trends aids in anticipating future payouts. Over the past three years, dividends grew by 18.56%, while a five-year growth shows a steady increase of 10.76%. This trend is indicative of sustained revenue growth and potential for future increases in line with corporate earnings.
| Time | Growth |
|---|---|
| 3 years | 18.56% |
| 5 years | 10.76% |
The average dividend growth is 10.76% over 5 years. This shows moderate but steady dividend growth.
💼 Payout Ratio
Payout ratios are essential to assessing a company's ability to sustain its dividends. A lower ratio communicates that the company retains enough earnings for growth and contingency. With an EPS-based payout ratio of 11.62% and a free cash flow-based ratio of 9.78%, the sustainability of the current dividend is affirmed, reflecting prudent financial practices.
| Key figure | Ratio |
|---|---|
| EPS-based | 11.62% |
| Free cash flow-based | 9.78% |
These ratios are favorable, indicating low risk of dividend cuts and ample room for potential future increases.
📈 Cashflow & Capital Efficiency
The robustness of a company's cash flow generation is pivotal to its dividend health. Westinghouse reflects a solid free cash flow yield, supported by efficient capital allocation, showcasing a CAPEX to operating cash flow ratio of 5.64%. The stock-based compensation is minimal relative to revenue, enhancing shareholder's interest.
| Metric | 2024 | 2023 | 2022 |
|---|---|---|---|
| Free Cash Flow Yield | 4.93% | 4.47% | 4.89% |
| Earnings Yield | 3.20% | 3.59% | 3.48% |
| CAPEX to Operating Cash Flow | 11.29% | 15.49% | 14.35% |
| Stock-based Compensation to Revenue | 0.64% | 0.49% | 0.49% |
| Free Cash Flow / Operating Cash Flow Ratio | 0.89 | 0.85 | 0.86 |
These metrics collectively suggest that Westinghouse’s cash flows are stable, supporting both operational needs and dividend commitments effectively.
📊 Balance Sheet & Leverage Analysis
An assessment of leverage and balance sheet health is crucial to evaluating financial resilience. Westinghouse demonstrates a conservative debt profile with a debt-to-equity ratio of 0.42 and a reasonable interest coverage ratio, affirming its capability to meet debt obligations comfortably.
| Metric | 2024 | 2023 | 2022 |
|---|---|---|---|
| Debt-to-Equity | 0.42 | 0.39 | 0.40 |
| Debt-to-Assets | 0.23 | 0.21 | 0.22 |
| Debt-to-Capital | 0.30 | 0.28 | 0.28 |
| Net Debt to EBITDA | 1.73 | 1.93 | 2.36 |
| Current Ratio | 1.30 | 1.20 | 1.25 |
| Quick Ratio | 0.69 | 0.63 | 0.66 |
| Financial Leverage | 1.85 | 1.81 | 1.83 |
This balanced leverage profile suggests a prudent financial strategy, ensuring sustainability in various economic conditions.
📊 Fundamental Strength & Profitability
Fundamental strength and profitability analysis reflects a company's efficiency and competitiveness. Westinghouse's margins and returns underpin a solid operational stance, driving profitability while maintaining competitive advantages.
| Metric | 2024 | 2023 | 2022 |
|---|---|---|---|
| Return on Equity | 10.46% | 7.77% | 6.27% |
| Return on Assets | 5.65% | 4.29% | 3.42% |
| Net Profit Margin | 10.17% | 8.42% | 7.57% |
| EBIT Margin | 15.51% | 13.54% | 12.44% |
| EBITDA Margin | 19.93% | 18.47% | 17.53% |
| Gross Margin | 32.41% | 30.42% | 30.38% |
| Research & Development to Revenue | 1.98% | 2.25% | 2.50% |
The company's consistent performance is indicative of efficient management practices and a strategic focus on growth and profitability.
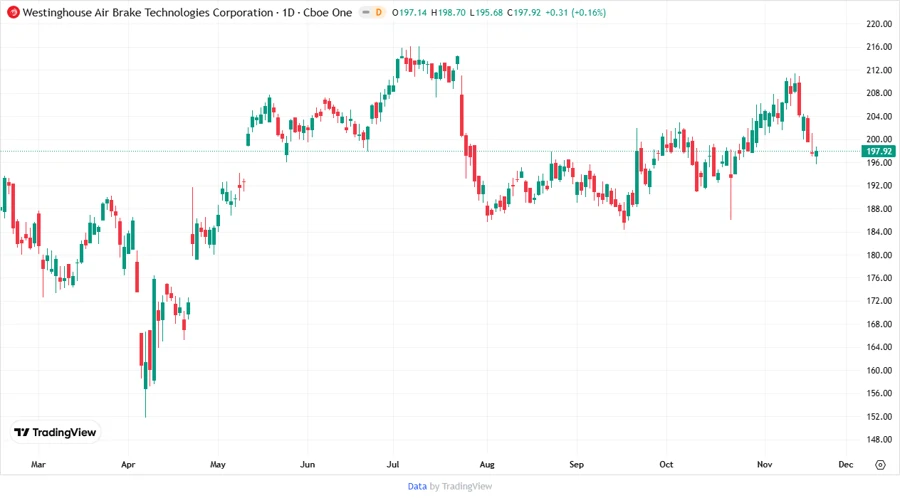
📉 Price Development
✅ Dividend Scoring System
| Category | Score | Score Bar |
|---|---|---|
| Dividend Yield | 2 | |
| Dividend Stability | 5 | |
| Dividend Growth | 4 | |
| Payout Ratio | 5 | |
| Financial Stability | 4 | |
| Dividend Continuity | 5 | |
| Cashflow Coverage | 4 | |
| Balance Sheet Quality | 4 |
Overall Score: 33/40
🗣️ Rating
Westinghouse Air Brake Technologies Corporation presents a reliable investment opportunity for dividend-focused portfolios. Despite a modest yield, the firm boasts an impressive record of dividend stability and growth. Given its low payout ratios and strong financial metrics, it is well-positioned to sustain and potentially enhance its dividend offerings. This makes the company a worthwhile consideration for investors seeking steady dividend income and long-term growth potential.
Smart Data Insight
Master the Perfect Entry & Exit for this Stock
Don't leave your profits to chance. Historically, this stock follows specific seasonal patterns that institutional traders use to maximize returns.
- ✅ Identify the "Golden Buying Window"
- ✅ Avoid high-risk correction cycles
- ✅ Backtested data from the last 20+ years