November 02, 2025 a 12:46 pm


WAB: Dividend Analysis - Westinghouse Air Brake Technologies Corporation
Westinghouse Air Brake Technologies Corporation (WAB) presents a stable dividend profile with a dividend history of 31 consecutive years without cuts or suspensions. This steady record is indicative of WAB’s commitment to returning value to its shareholders. Despite a modest current dividend yield, the corporation has demonstrated consistent dividend growth, reflective of its robust financial health. The assessments below provide deeper insights into the company's dividend sustainability and financial solidity.
📊 Overview
The core metrics of the Westinghouse Air Brake Technologies Corporation suggest a stable foundation for dividend payouts. The company is positioned within a sector known for capital-intensive operations yet maintains a commendable history of dividend payments.
| Factor | Details |
|---|---|
| Sector | Transportation Equipment |
| Dividend yield | 0.49% |
| Current dividend per share | USD 0.80 |
| Dividend history | 31 years |
| Last cut or suspension | None |
🗣️ Dividend History
WAB's dividend history underlines its 31-year streak of maintaining uninterrupted dividend payouts. This unwavering record suggests a strong management commitment towards its shareholders and the ability to sustain cash flow even during economic downturns.
| Year | Dividend per Share (USD) |
|---|---|
| 2025 | 1.00 |
| 2024 | 0.80 |
| 2023 | 0.68 |
| 2022 | 0.60 |
| 2021 | 0.48 |
📈 Dividend Growth
WAB has exhibited powerful dividend growth trajectories over the past 3 to 5 years, suggesting its ability to enhance shareholder value over time through increased payout returns.
| Time | Growth |
|---|---|
| 3 years | 18.56% |
| 5 years | 10.76% |
The average dividend growth is 10.76% over 5 years. This shows moderate but steady dividend growth.
⚖️ Payout Ratio
A low payout ratio indicates that WAB retains a significant portion of earnings and free cash flow, which bodes well for future investment and dividend sustainability.
| Key Figure | Ratio |
|---|---|
| EPS-based | 11.62% |
| Free cash flow-based | 9.78% |
The EPS-based payout ratio of 11.62% and a free cash flow payout ratio of 9.78% demonstrate a conservative and sustainable dividend policy.
💸 Cashflow & Capital Efficiency
Analyzing the cash flow and capital efficiency metrics reveals WAB's efficiency in managing operations and deriving maximum returns from its capital investments, a crucial factor for sustained growth and dividend stability.
| Year | 2022 | 2023 | 2024 |
|---|---|---|---|
| Free Cash Flow Yield | 4.89% | 4.47% | 4.93% |
| Earnings Yield | 3.48% | 3.59% | 3.20% |
| CAPEX to Operating Cash Flow | 14.35% | 15.49% | 11.29% |
| Stock-based Compensation to Revenue | 0.49% | 0.49% | 0.64% |
| Free Cash Flow / Operating Cash Flow Ratio | 0.86 | 0.85 | 0.89 |
The stability of WAB's cash flows and capital returns signifies a well-managed company with robust investment strategies.
🔍 Balance Sheet & Leverage Analysis
The debt-to-equity and leverage ratios suggest a balanced approach towards leveraged financing, keeping the financial health feasible while facilitating growth opportunities.
| Year | 2022 | 2023 | 2024 |
|---|---|---|---|
| Debt-to-Equity | 0.40 | 0.39 | 0.42 |
| Debt-to-Assets | 0.22 | 0.21 | 0.23 |
| Debt-to-Capital | 0.28 | 0.28 | 0.30 |
| Net Debt to EBITDA | 2.36 | 1.93 | 1.73 |
| Current Ratio | 1.25 | 1.20 | 1.30 |
| Quick Ratio | 0.66 | 0.63 | 0.69 |
WAB's balance sheet indicates stringent financial discipline with a manageable debt level conducive to maintaining financial stability.
📊 Fundamental Strength & Profitability
Key profitability metrics such as return on equity and margins are reflective of a company that generates healthy returns on assets and maintains efficient operational cost management.
| Year | 2022 | 2023 | 2024 |
|---|---|---|---|
| Return on Equity | 6.27% | 7.77% | 10.46% |
| Return on Assets | 3.42% | 4.29% | 5.65% |
| Net Margin | 7.57% | 8.42% | 10.17% |
| EBIT Margin | 12.44% | 13.54% | 15.51% |
| EBITDA Margin | 17.53% | 18.47% | 19.93% |
Robust returns and profitability margins underscore WAB’s ability to sustain competitive advantage and shareholder assurance.
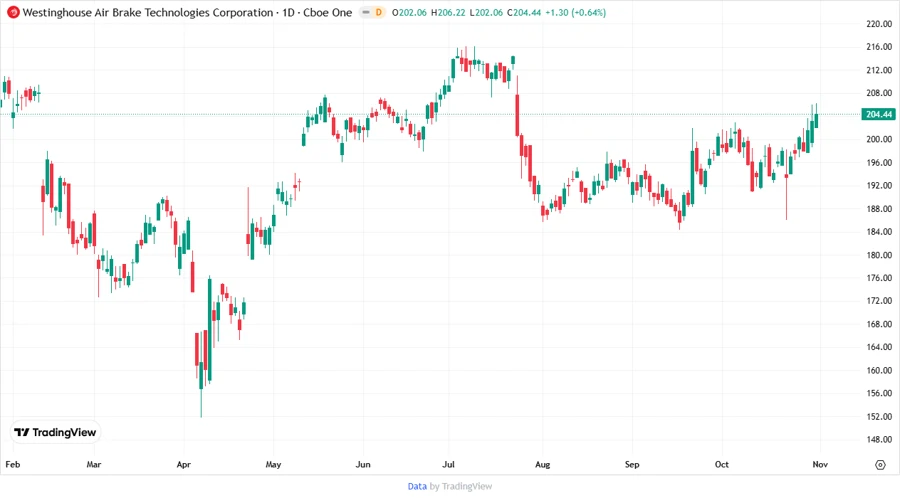
📈 Price Development
✅ Dividend Scoring System
| Category | Score | Rating |
|---|---|---|
| Dividend yield | 3 | |
| Dividend Stability | 5 | |
| Dividend growth | 4 | |
| Payout ratio | 5 | |
| Financial stability | 4 | |
| Dividend continuity | 5 | |
| Cashflow Coverage | 5 | |
| Balance Sheet Quality | 4 |
Total Score: 35/40
🔍 Rating
Westinghouse Air Brake Technologies Corporation earns a commendable score with an overall robust dividend profile. With a steady dividend growth trajectory and strong financial underpinnings, this company represents a reliable option for dividend-seeking investors. Overall, WAB presents itself as a strong buy for those valuing dividend reliability alongside solid growth prospects.
Smart Data Insight
Master the Perfect Entry & Exit for this Stock
Don't leave your profits to chance. Historically, this stock follows specific seasonal patterns that institutional traders use to maximize returns.
- ✅ Identify the "Golden Buying Window"
- ✅ Avoid high-risk correction cycles
- ✅ Backtested data from the last 20+ years