October 23, 2025 a 07:31 am
WAB: Dividend Analysis - Westinghouse Air Brake Technologies Corporation
Westinghouse Air Brake Technologies Corporation, with its strong presence in the sector, is an investment that demonstrates promising dividend characteristics. Despite a modest dividend yield of 0.52%, the company boasts a long history of 31 years of uninterrupted dividend payments, underscoring its commitment to returning value to shareholders. The company has shown moderate growth, with a 5-year average dividend increase of 10.76%. Its solid financial indicators, combined with low payout ratios, suggest sustainability moving forward.
📊 Overview
Westinghouse Air Brake Technologies Corporation operates within the Rail Transportation equipment sector, providing significant investment opportunities due to its diverse global operations. Here are the key dividend metrics:
| Attribute | Value |
|---|---|
| Sector | Rail Transportation |
| Dividend yield | 0.52% |
| Current dividend per share | 0.80 USD |
| Dividend history | 31 years |
| Last cut or suspension | None |
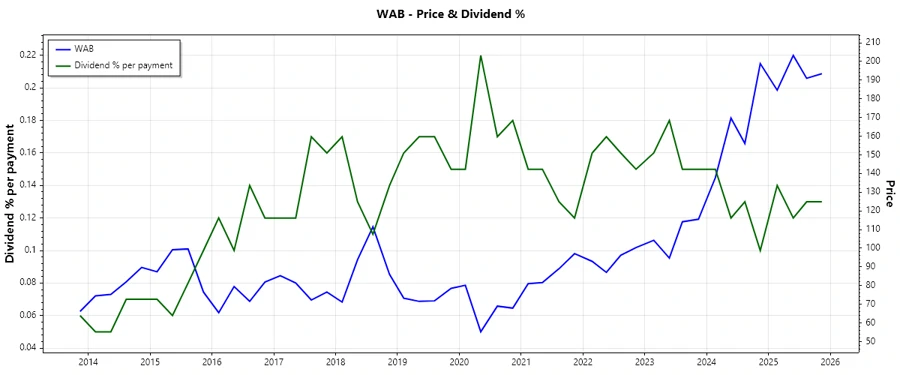
🔎 Dividend History
Understanding dividend history is crucial as it reflects the reliability and consistency of returns to investors. WAB has a commendable record with continuous distributions, fostering investor confidence.
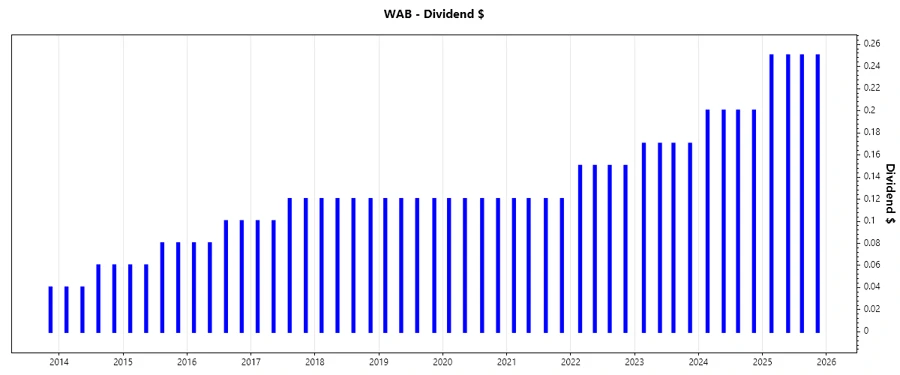
| Year | Dividend Per Share (USD) |
|---|---|
| 2025 | 1.00 |
| 2024 | 0.80 |
| 2023 | 0.68 |
| 2022 | 0.60 |
| 2021 | 0.48 |
📈 Dividend Growth
Dividend growth rates highlight potential increases in shareholder returns over time. Consistent growth indicates robust business health and management confidence.
| Time | Growth |
|---|---|
| 3 years | 18.56% |
| 5 years | 10.76% |
The average dividend growth is 10.76% over 5 years. This shows moderate but steady dividend growth.
📉 Payout Ratio
Payout ratios, derived from earnings and free cash flow, provide insights into a company’s ability to maintain its dividend payments.
| Key figure | Ratio |
|---|---|
| EPS-based | 11.62% |
| Free cash flow-based | 9.78% |
The EPS payout ratio of 11.62% and the FCF payout ratio of 9.78% indicate a well-covered dividend, suggesting prudence in maintaining shareholder distributions.
✅ Cashflow & Capital Efficiency
Assessing a company's cash flow and capital efficiency is vital to understand its operational health and potential to fund capital projects or return cash to shareholders.
| Metric | 2024 | 2023 | 2022 |
|---|---|---|---|
| Free Cash Flow Yield | 4.93% | 4.47% | 4.89% |
| Earnings Yield | 3.20% | 3.59% | 3.48% |
| CAPEX to Operating Cash Flow | 11.29% | 15.49% | 14.35% |
| Stock-based Compensation to Revenue | 0.64% | 0.49% | 0.49% |
| Free Cash Flow / Operating Cash Flow Ratio | 88.71% | 84.51% | 85.65% |
These figures suggest a stable cash flow foundation with decent capital efficiency, enhancing investment reliability.
🗣️ Balance Sheet & Leverage Analysis
Analyzing the balance sheet provides insight into debt structure and financial health, guarding against insolvency risk.
| Metric | 2024 | 2023 | 2022 |
|---|---|---|---|
| Debt-to-Equity | 42.49% | 38.80% | 39.62% |
| Debt-to-Assets | 22.93% | 21.43% | 21.61% |
| Debt-to-Capital | 29.82% | 27.95% | 28.37% |
| Net Debt to EBITDA | 1.73 | 1.93 | 2.36 |
| Current Ratio | 1.42 | N/A | N/A |
| Quick Ratio | 0.69 | 0.63 | 0.66 |
| Financial Leverage | 1.85 | 1.81 | 1.83 |
The leverage ratios indicate a conservative approach to gearing, enhancing financial stability and resilience.
📈 Fundamental Strength & Profitability
A company's fundamental strength and profitability metrics provide a snapshot of its operational success and financial durability.
| Metric | 2024 | 2023 | 2022 |
|---|---|---|---|
| Return on Equity | 10.46% | 7.77% | 6.27% |
| Return on Assets | 5.65% | 4.29% | 3.42% |
| Margins: Net | 10.17% | 8.42% | 7.57% |
| EBIT | 15.51% | 13.54% | 12.44% |
| EBITDA | 19.93% | 18.47% | 17.53% |
| Gross | 32.41% | 30.42% | 30.38% |
| Research & Development to Revenue | 1.98% | 2.25% | 2.50% |
The robust ROE and high profit margins underscore strong operational efficiency and strategic focus on delivering shareholder value.
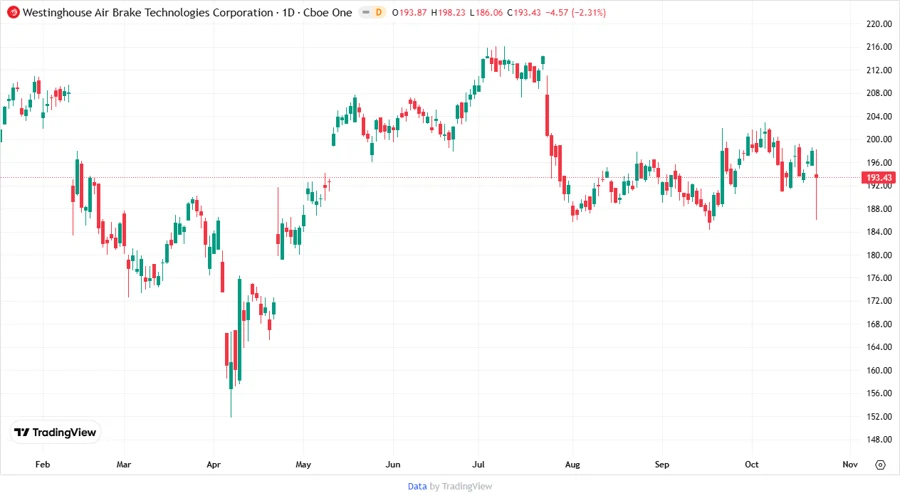
📊 Price Development
💡 Dividend Scoring System
| Criterion | Description | Score |
|---|---|---|
| Dividend yield | Reflects the cash return to shareholders. | |
| Dividend Stability | Consistent payment history. | |
| Dividend growth | Degree of increase in dividends. | |
| Payout ratio | Income versus dividend flow. | |
| Financial stability | Strength of financials. | |
| Dividend continuity | Uninterrupted dividend tracks. | |
| Cashflow Coverage | Adequacy of free cash flow to cover dividends. | |
| Balance Sheet Quality | Debt levels and asset protection. |
Overall Score: 63/80
🔍 Rating
Overall, Westinghouse Air Brake Technologies Corporation demonstrates a solid track record of steady dividend growth and financial prudence. Its moderate yield is complemented by a robust commitment to maintaining and growing dividends, making it a fitting choice for investors seeking stable returns in the industrial sector.
Smart Data Insight
Master the Perfect Entry & Exit for this Stock
Don't leave your profits to chance. Historically, this stock follows specific seasonal patterns that institutional traders use to maximize returns.
- ✅ Identify the "Golden Buying Window"
- ✅ Avoid high-risk correction cycles
- ✅ Backtested data from the last 20+ years