August 15, 2025 a 03:31 am


WAB Dividend Analysis - Westinghouse Air Brake Technologies Corporation
Westinghouse Air Brake Technologies Corporation exhibits a robust dividend profile characterized by a solid history of 31 consecutive years of paying dividends. With its current dividend yield standing at 0.50%, the stock offers a modest income stream. However, both the low payout ratios and the company's history of consistent dividend growth over the past five years suggest potential for future increases in dividend payouts. The financial soundness reflected in the balance sheet metrics and high coverage ratios further reinforce the stock's stability.
📊 Overview
Westinghouse Air Brake Technologies Corporation's dividend performance is characterized by its solid history and future potential. The company belongs to the industrial sector and presents a relatively low but stable dividend yield.
| Data Point | Value |
|---|---|
| Sector | Industrial |
| Dividend Yield | 0.50% |
| Current Dividend Per Share | $0.80 |
| Dividend History | 31 years |
| Last Cut or Suspension | None |
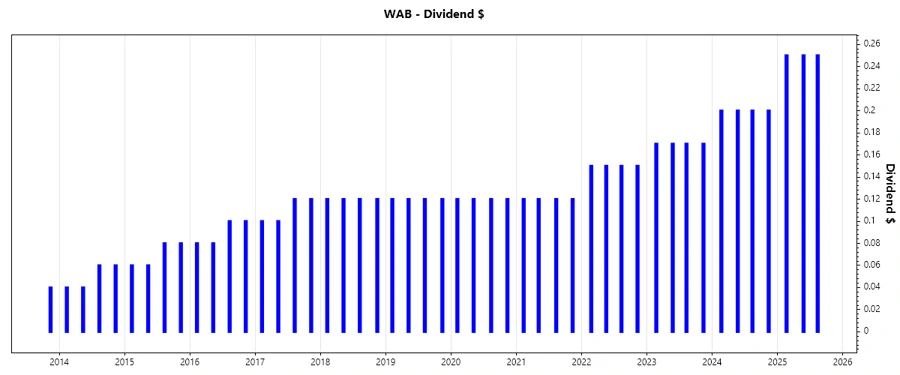
📈 Dividend History
The dividend history indicates a consistent increase in payments over the years, which is a good indicator of reliability and management's commitment to distributing profits to shareholders.
| Year | Dividend Per Share |
|---|---|
| 2025 | $0.75 |
| 2024 | $0.80 |
| 2023 | $0.68 |
| 2022 | $0.60 |
| 2021 | $0.48 |
🗣️ Dividend Growth
The company's dividend growth rates over the past 3 and 5 years showcase a phase of moderate but stable increases, indicating management's ability to enhance shareholder returns consistently.
| Time | Growth |
|---|---|
| 3 years | 0.19% |
| 5 years | 0.11% |
The average dividend growth is 0.11% over 5 years. This shows moderate but steady dividend growth.
✅ Payout Ratio
The payout ratios are crucial indicators of how sustainable the current dividend level is. A low payout ratio suggests that there is ample room for the company to maintain or even increase dividends while still investing in growth opportunities.
| Key Figure | Ratio |
|---|---|
| EPS-based | 11.90% |
| Free cash flow-based | 9.47% |
With an EPS-based payout ratio of 11.90% and an FCF-based ratio of 9.47%, Westinghouse Air Brake Technologies Corporation has a conservative dividend policy, leaving substantial capacity for future dividend hikes.
🗓️ Cashflow & Capital Efficiency
The cash flow and capital efficiency measures help us understand the company's operational efficacy and its ability to generate cash relative to its debt obligations and capital investments.
| Metric | 2024 | 2023 | 2022 |
|---|---|---|---|
| Free Cash Flow Yield | 4.93% | 4.47% | 4.89% |
| Earnings Yield | 3.20% | 3.59% | 3.48% |
| CAPEX to Operating Cash Flow | 11.29% | 15.49% | 14.35% |
| Stock-based Compensation to Revenue | 0.63% | 0.49% | 0.49% |
| Free Cash Flow / Operating Cash Flow Ratio | 88.71% | 84.51% | 85.65% |
Westinghouse Air Brake Technologies Corporation displays robust cash flow stability, which is vital for maintaining dividend payouts and reinvesting for growth, as evidenced by a consistent Free Cash Flow to Operating Cash Flow ratio.
🌀 Balance Sheet & Leverage Analysis
The balance sheet analysis provides insights into the company's financial health, examining its capacity to meet liabilities and fund its operations independently of external financing.
| Metric | 2024 | 2023 | 2022 |
|---|---|---|---|
| Debt-to-Equity | 0.39 | 0.42 | 0.40 |
| Debt-to-Assets | 0.21 | 0.23 | 0.22 |
| Debt-to-Capital | 0.28 | 0.29 | 0.28 |
| Net Debt to EBITDA | 1.59 | 2.11 | 2.28 |
| Current Ratio | 1.30 | 1.20 | 1.25 |
| Quick Ratio | 0.69 | 0.63 | 0.66 |
| Financial Leverage | 1.85 | 1.81 | 1.83 |
The company's leverage ratios suggest a well-managed balance sheet, with the Debt-to-Equity ratio remaining stable and manageable across the observed years.
🔍 Fundamental Strength & Profitability
Analyzing the fundamental and profitability metrics provides a clearer picture of the company's operational efficiency, its competitive positioning, and how profits are derived.
| Metric | 2024 | 2023 | 2022 |
|---|---|---|---|
| Return on Equity | 10.46% | 7.77% | 6.27% |
| Return on Assets | 5.65% | 4.29% | 3.42% |
| Margins: Net | 10.17% | 8.42% | 7.57% |
| EBIT Margin | 15.51% | 13.54% | 12.44% |
| EBITDA Margin | 15.49% | 18.47% | 18.17% |
| Gross Margin | 32.41% | 30.42% | 27.41% |
| Research & Development to Revenue | 1.98% | 2.25% | 2.50% |
The profitability metrics reflect a strong operational framework with increasing returns and stable margins, suggesting a competitive edge in its industry.
📉 Price Development
🎯 Dividend Scoring System
An internal scoring system evaluates key dividend criteria to provide an overall perspective on the stock's dividend attractiveness.
| Category | Score | Score Bar |
|---|---|---|
| Dividend Yield | 2/5 | |
| Dividend Stability | 5/5 | |
| Dividend Growth | 3/5 | |
| Payout Ratio | 4/5 | |
| Financial Stability | 5/5 | |
| Dividend Continuity | 5/5 | |
| Cashflow Coverage | 4/5 | |
| Balance Sheet Quality | 4/5 |
Total Score: 32/40
🌟 Rating
Westinghouse Air Brake Technologies Corporation demonstrates a compelling dividend profile, driven by its consistent dividend history and robust financial foundation. Despite the lower dividend yield, the stability and growth potential offer a reassuring prospect for income-focused investors with a balanced strategy. The overall assessment points to a stable investment with opportunities for gradual dividend appreciation.
Smart Data Insight
Master the Perfect Entry & Exit for this Stock
Don't leave your profits to chance. Historically, this stock follows specific seasonal patterns that institutional traders use to maximize returns.
- ✅ Identify the "Golden Buying Window"
- ✅ Avoid high-risk correction cycles
- ✅ Backtested data from the last 20+ years