July 08, 2025 a 07:31 am


WAB: Dividend Analysis - Westinghouse Air Brake Technologies Corporation
Westinghouse Air Brake Technologies Corporation exhibits a moderate dividend profile with a strategic emphasis on sustainable payouts. While the dividend yield is quite modest, the company's consistent dividend history over 31 years showcases its commitment to rewarding shareholders. The stable financial metrics support future growth.
📊 Overview
Westinghouse Air Brake Technologies Corp operates in a sector marked by innovation and steady growth. With a dividend yield of 0.44%, the current dividend per share stands at USD 0.80. Importantly, the firm boasts a substantial dividend history, unbroken for 31 years.
| Metric | Details |
|---|---|
| Sector | Transportation |
| Dividend Yield | 0.44% |
| Current Dividend Per Share | USD 0.80 |
| Dividend History | 31 years |
| Last Cut or Suspension | None |
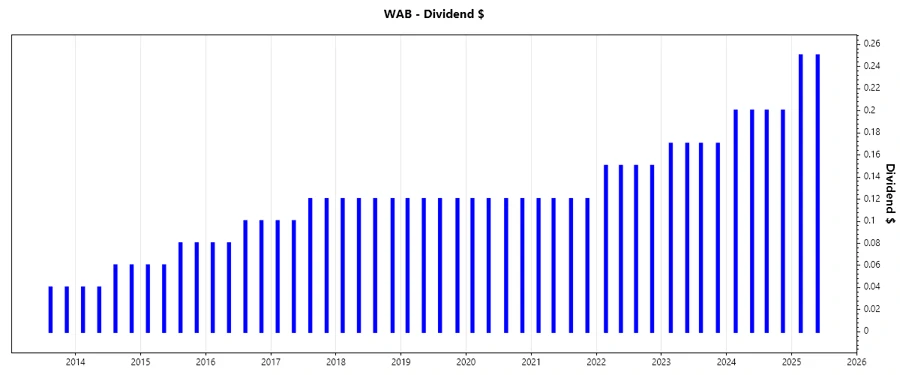
📉 Dividend History
The company's robust dividend history, with incremental increases in recent years, signals financial health and shareholder trust. Such reliability is pivotal for long-term investors seeking stable returns.
| Year | Dividend Per Share |
|---|---|
| 2025 | USD 0.50 |
| 2024 | USD 0.80 |
| 2023 | USD 0.68 |
| 2022 | USD 0.60 |
| 2021 | USD 0.48 |
📈 Dividend Growth
Exhibiting a dividend growth rate of 18.56% over the past three years, the company's five-year growth rate of 10.76% indicates a steady increase.
| Time | Growth |
|---|---|
| 3 years | 18.56% |
| 5 years | 10.76% |
The average dividend growth is 10.76% over 5 years, showcasing moderate but steady dividend growth.
✅ Payout Ratio
A critical measure of dividend sustainability, the EPS payout ratio of 12.40% and FCF payout ratio of 9.35% highlight the company's conservative approach to maintaining payouts well within earnings and cash flow capabilities.
| Key figure ratio | Percentage |
|---|---|
| EPS-based | 12.40% |
| Free cash flow-based | 9.35% |
The low payout ratios imply ample room for potential dividend increases while safeguarding capital for reinvestment and debt servicing.
Cashflow & Capital Efficiency
Efficient cash flow management and capital allocation are key to sustainable growth. Westinghouse Air Brake Technologies exhibits prudent capital spending and healthy free cash flow ratios, crucial for strategic expansion and shareholder value preservation.
| Year | 2024 | 2023 | 2022 |
|---|---|---|---|
| Free Cash Flow Yield | 4.93% | 4.47% | 4.89% |
| Earnings Yield | 3.20% | 3.59% | 3.48% |
| CAPEX to Operating Cash Flow | 11.29% | 15.49% | 14.35% |
| Stock-based Compensation to Revenue | 0.64% | 0.61% | 0.49% |
| Free Cash Flow / Operating Cash Flow Ratio | 88.71% | 84.51% | 85.65% |
Positive cash flow metrics reinforce the company's capacity to cover dividends and facilitate growth projects, crucial for long-term viability.
Balance Sheet & Leverage Analysis
Analyzing the balance sheet reveals a proactive strategy in debt management, crucial for buffering economic uncertainties and leveraging growth opportunities.
| Year | 2024 | 2023 | 2022 |
|---|---|---|---|
| Debt-to-Equity | 0.39 | 0.42 | 0.40 |
| Debt-to-Assets | 0.21 | 0.23 | 0.22 |
| Debt-to-Capital | 0.28 | 0.29 | 0.28 |
| Net Debt to EBITDA | 2.03 | 2.11 | 2.28 |
| Current Ratio | 1.30 | 1.20 | 1.25 |
| Quick Ratio | 0.69 | 0.63 | 0.66 |
| Financial Leverage | 1.85 | 1.81 | 1.83 |
Balanced leverage metrics support financial stability, enhancing the firm’s resilience against market fluctuations and potential crises.
Fundamental Strength & Profitability
Fundamental analysis showcases robust profitability metrics indicating efficient operational management and strategic market positioning.
| Year | 2024 | 2023 | 2022 |
|---|---|---|---|
| Return on Equity | 10.46% | 7.77% | 6.27% |
| Return on Assets | 5.65% | 4.29% | 3.42% |
| Margins: Net | 10.17% | 8.42% | 7.57% |
| EBIT | 15.51% | 13.54% | 12.44% |
| EBITDA | 15.49% | 18.47% | 18.17% |
| Gross | 32.41% | 30.42% | 27.41% |
| Research & Development to Revenue | 1.98% | 2.25% | 2.50% |
High ROI figures underpin the corporation's sound financial health and provide a strong basis for sustaining competitive advantage.
Price Development
Dividend Scoring System
| Criteria | Score | Bar |
|---|---|---|
| Dividend Yield | 3 | |
| Dividend Stability | 4 | |
| Dividend Growth | 3 | |
| Payout Ratio | 4 | |
| Financial Stability | 5 | |
| Dividend Continuity | 5 | |
| Cashflow Coverage | 4 | |
| Balance Sheet Quality | 5 |
Total Score: 33/40
🔍 Rating
With a comprehensive analysis of its dividend profile and financial metrics, Westinghouse Air Brake Technologies demonstrates solid fundamentals and a commitment to investor returns. The company merits a favorable outlook for dividend investors seeking stable growth with manageable risk.
Smart Data Insight
Master the Perfect Entry & Exit for this Stock
Don't leave your profits to chance. Historically, this stock follows specific seasonal patterns that institutional traders use to maximize returns.
- ✅ Identify the "Golden Buying Window"
- ✅ Avoid high-risk correction cycles
- ✅ Backtested data from the last 20+ years