January 28, 2026 a 01:16 pm


V: Trend and Support & Resistance Analysis - Visa Inc.
Visa Inc. operates within the global payments space, continually adapting to the dynamic financial technology landscape. Recently, the stock has experienced significant movements, attributed in part to its strategic initiatives and partnerships. The trends and support/resistance levels highlighted in this analysis provide insights into potential future performance. By understanding these patterns, investors can better gauge the company's market position and investment appeal.
Trend Analysis
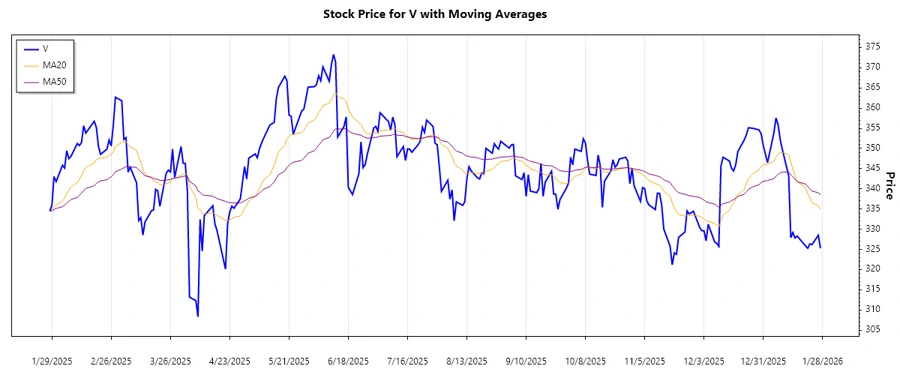
The recent trend for Visa Inc. stock indicates fluctuating movements, with noticeable volatility driven by market dynamics.
| Date | Close Price | Trend |
|---|---|---|
| 2026-01-27 | $325.26 | ▼ Abwärtstrend |
| 2026-01-26 | $328.49 | ▼ Abwärtstrend |
| 2026-01-23 | $326.18 | ▼ Abwärtstrend |
| 2026-01-22 | $326.36 | ▼ Abwärtstrend |
| 2026-01-21 | $325.28 | ▼ Abwärtstrend |
| 2026-01-20 | $325.82 | ▼ Abwärtstrend |
| 2026-01-16 | $328.30 | ▼ Abwärtstrend |
Based on the calculated EMAs, the technical trend for Visa is currently a ▼ Abwärtstrend (downtrend), as the EMA20 is below the EMA50. This suggests that recently, selling pressure has exceeded buying interest.
Support- and Resistance
Key support and resistance levels are essential for investors to identify potential entry and exit points in Visa's stock.
| Zone Type | From | To |
|---|---|---|
| Support | ▲ $325.00 | ▲ $329.00 |
| Support | ▲ $320.00 | ▲ $324.00 |
| Resistance | ▼ $335.00 | ▼ $340.00 |
| Resistance | ▼ $345.00 | ▼ $350.00 |
Currently, the stock is trending close to a support zone, suggesting potential support at these levels unless bearish pressure continues to dominate.
Conclusion
Visa Inc.'s stock shows a downtrend, presenting potential buying opportunities near identified support levels for risk-tolerant investors expecting a price reversal. Conversely, it is crucial to exercise caution due to prevailing bearish trends indicated by current technicals. Overall, understanding these patterns provides a foundation for making informed decisions, balancing risk against potential rewards.