
July 15, 2026 a 03:43 pm
V: Fundamental Ratio Analysis - Visa Inc.
Visa Inc. operates in a dynamic industry as a leading provider of payment solutions. The company’s robust transaction network, VisaNet, supports its impressive operational prowess. Despite a challenging market, Visa's commitment to innovation and global partnerships, like that with Ooredoo, position it for continued growth.
Fundamental Rating
The fundamental rating reflects Visa Inc.'s strong financial health, evidenced by high returns on equity and assets. The company maintains solid fundamentals despite a moderate debt level.
| Category | Score | |
|---|---|---|
| Discounted Cash Flow | 4 | |
| Return on Equity | 5 | |
| Return on Assets | 5 | |
| Debt to Equity | 2 | |
| Price to Earnings | 1 | |
| Price to Book | 1 |
Historical Rating
Analysis of historical scores indicates consistent performance in crucial areas like ROE and ROA, though price metrics reveal value concerns.
| Date | Overall | DCF | ROE | ROA | Debt to Equity | P/E | P/B |
|---|---|---|---|---|---|---|---|
| 2026-07-14 | 3 | 4 | 5 | 5 | 2 | 1 | 1 |
| No data | 0 | 4 | 5 | 5 | 2 | 1 | 1 |
Analyst Price Targets
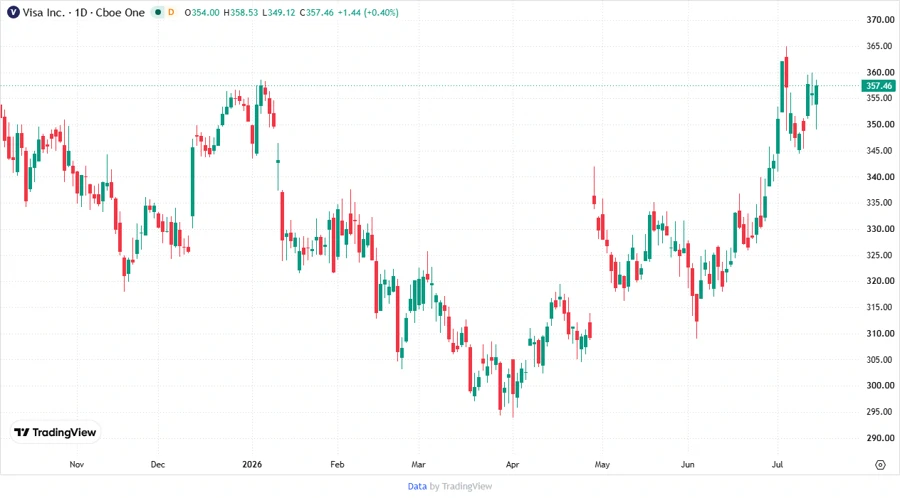
Analysts project positive future stock price growth, indicating a consensus that aligns with a target exceeding current valuation.
| High | Low | Median | Consensus |
|---|---|---|---|
| $450 | $350 | $394 | $395.85 |
Analyst Sentiment
The analyst sentiment showcases a strong foundational belief in Visa’s potential market movements, with a majority leaning towards buying.
| Recommendation | Number | |
|---|---|---|
| Strong Buy | 0 | |
| Buy | 52 | |
| Hold | 9 | |
| Sell | 0 | |
| Strong Sell | 0 |
Conclusion
Visa Inc. stands as a robust entity within the financial services sector, fortified by its industry-leading infrastructure and strategic alliances. While the current valuation metrics indicate some potential overvaluation, the consistent high returns and promising analyst projections underscore growth opportunities. Investors should be aware of market fluctuations and competition in the payment processing industry as potential risks. Overall, Visa Inc.'s strong market position and innovation-driven strategy justify its favorable prospects in the long term.
Smart Data Insight
Master the Perfect Entry & Exit for this Stock
Don't leave your profits to chance. Historically, this stock follows specific seasonal patterns that institutional traders use to maximize returns.
- ✅ Identify the "Golden Buying Window"
- ✅ Avoid high-risk correction cycles
- ✅ Backtested data from the last 20+ years