
July 26, 2026 a 05:15 am
V: Fibonacci Analysis - Visa Inc.
The Visa Inc. stock has shown a strong uptrend over the last few months, indicating positive sentiment. The company's solid fundamental outlook supports this trend, reinforcing confidence among investors. Continued strength in digital payment solutions and strategic partnerships positions Visa Inc. well in the market.
Fibonacci Analysis
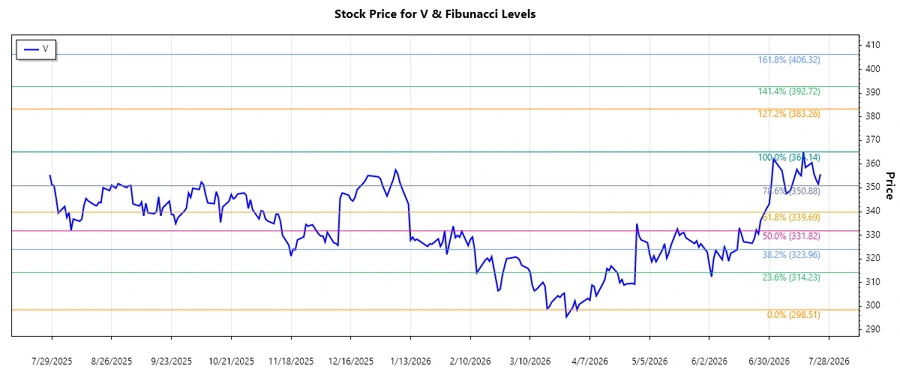
The stock price of Visa Inc. has experienced an upward trend from April 1, 2026, to July 23, 2026. The analysis identifies key Fibonacci retracement levels that align with potential support and resistance areas.
| Start Date | End Date | High Price | High Date | Low Price | Low Date |
|---|---|---|---|---|---|
| 2026-04-01 | 2026-07-23 | 365.14 | 2026-07-16 | 298.51 | 2026-04-01 |
| Fibonacci Level | Price Level |
|---|---|
| 0.236 | 330.84 |
| 0.382 | 340.88 |
| 0.5 | 346.83 |
| 0.618 | 352.79 |
| 0.786 | 360.15 |
Currently, the stock is trading at $355.74. It is within the 0.618 retracement zone, indicating a possible support level.
The retracement at this level suggests a strong support, which might prevent further decline in the stock's price and could potentially lead to a continuation of the upward trend.
Conclusion
Visa Inc.'s recent uptrend reflects a robust business model strongly supported by ongoing digital transformation and strategic partnerships. The presence of the stock within a critical Fibonacci retracement level highlights a possible strong support area that could sustain its upward momentum. However, investors should be aware of market volatility that might affect short-term price movements. Long-term prospects remain positive as Visa continues to innovate and adapt to global payment trends, making it an attractive option for growth-oriented investors.
Smart Data Insight
Master the Perfect Entry & Exit for this Stock
Don't leave your profits to chance. Historically, this stock follows specific seasonal patterns that institutional traders use to maximize returns.
- ✅ Identify the "Golden Buying Window"
- ✅ Avoid high-risk correction cycles
- ✅ Backtested data from the last 20+ years