January 13, 2026 a 10:15 am
V: Fibonacci Analysis – Visa Inc.
Visa Inc. (Ticker: V) has exhibited resilience in the payments technology landscape, leveraging its global network to continue growth despite geopolitical and economic headwinds. Recent trends indicate a recovery phase following previous volatility, reflecting broader market optimism. Investors should remain cautiously optimistic as ongoing innovations and strategic partnerships bolster Visa’s market position.
Fibonacci Analysis
| Analysis Element | Details |
|---|---|
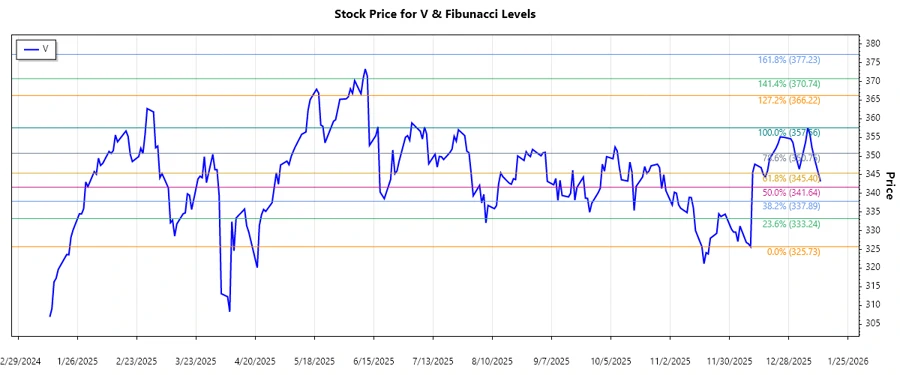
| Analyzed Trend | An upward trend from Dec 10, 2025, to Jan 6, 2026 |
| High Point | $357.56 on 2026-01-06 |
| Low Point | $325.73 on 2025-12-10 |
| Fibonacci Level | Price Level |
|---|---|
| 0.236 | $332.24 |
| 0.382 | $339.24 |
| 0.5 | $341.645 |
| 0.618 | $349.45 |
| 0.786 | $352.67 |
The current price of $343.2 is within the 0.382 to 0.5 retracement zone, potentially acting as a support area. This suggests a pause before potentially resuming its upward momentum.
Conclusion
Visa Inc.'s recent upward trend reflects positive market sentiment and investor confidence, partly driven by its robust payment technologies and strategic collaborations. Although there is potential for support at the current retracement level, market volatility remains a risk factor. A deeper retracement could lead to extended consolidation, yet the company’s strong fundamentals and market position could sustain long-term growth. Analysts should monitor key support levels and broader economic indicators to gauge market movements.