November 19, 2025 a 06:44 am
V: Fibonacci Analysis - Visa Inc.
Visa Inc. has exhibited resilience in a competitive payments technology landscape. As a leader in digital transactions, its stock has shown varying performance over time, with recent trends needing detailed technical analysis. Investors are keen on understanding its potential support and resistance levels for future moves.
Fibonacci Analysis
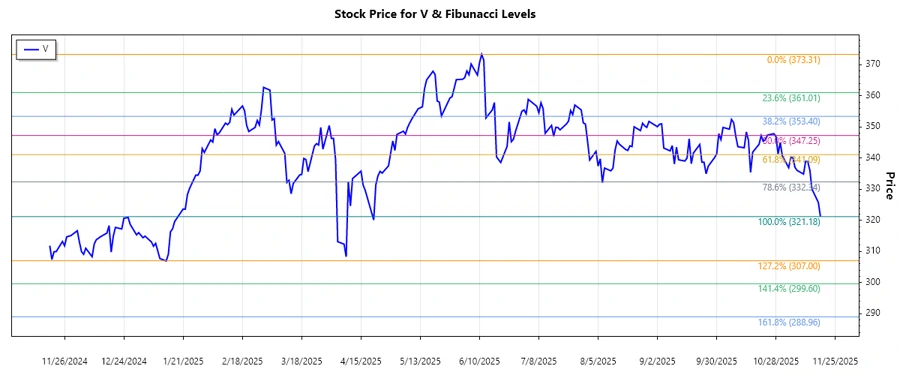
The recent trends in Visa Inc.'s stock suggest a dominant downturn, with prices experiencing a high followed by a decline. Based on historical data from July 2025 to November 2025, Fibonacci retracement levels have been calculated to ascertain potential support levels in this bearish phase.
| Detail | Value |
|---|---|
| Start Date | 2025-07-09 |
| End Date | 2025-11-18 |
| High Point | $373.31 (2025-06-11) |
| Low Point | $321.18 (2025-11-18) |
| Fibonacci Level | Price |
|---|---|
| 0.236 | $334.15 |
| 0.382 | $341.47 |
| 0.5 | $347.24 |
| 0.618 | $353.01 |
| 0.786 | $360.22 |
As of now, the current price is at $321.18, indicating that it is below the 0.236 retracement level. This suggests that the stock is in an extended bearish phase with potential support emerging at lower Fibonacci levels.
Technically, the stock price moving below the 0.236 retracement level could indicate stronger bearish momentum unless it stabilizes above the next levels, signaling potential recovery.
The stock chart illustrates the current Fibonacci retracement levels, highlighting potential support and resistance areas that can be crucial for traders.
Conclusion
Visa Inc.'s recent stock trend highlights potential risks associated with its current bearish momentum. However, the company's established position in the global payments market offers inherent opportunities once it surpasses short-term turbulence. Analysts should closely monitor price behavior at Fibonacci levels for indicators of a reversal, aiding in informed investment decisions. Understanding Visa's technical positioning will be crucial for speculating future price movements.