March 11, 2026 a 11:31 am


📊 Dividend Analysis - Visa Inc.
Visa Inc. is a globally recognized financial services corporation that has consistently demonstrated resilience and growth in its dividend payouts. With a low dividend yield reflective of its steady growth strategy, Visa continues to reward its shareholders with generous returns. This analysis will unravel the key strengths and metrics that position Visa Inc. as a robust choice for dividend-focused investors.
🗣️ Overview
Visa Inc., rooted in the Information Technology sector, has maintained a dividend yield of 0.77%. The current dividend per share stands at 2.39 USD, underpinned by a decade-long history of 19 years without cuts or suspensions, highlighting a strong commitment to shareholder value.
| Sector | Dividend Yield | Current Dividend per Share | Dividend History | Last Cut or Suspension |
|---|---|---|---|---|
| Information Technology | 0.77% | 2.39 USD | 19 years | None |
📈 Dividend History
Visa Inc.'s dividend history showcases enduring reliability, reflecting a consistent commitment to returning profits to shareholders. Its ability to increase dividend payouts yearly is indicative of strong financial health and strategic management.
| Year | Dividend per Share (USD) |
|---|---|
| 2026 | 0.67 |
| 2025 | 2.44 |
| 2024 | 2.15 |
| 2023 | 1.87 |
| 2022 | 1.575 |
🌱 Dividend Growth
The dividend growth rate over 3 years is at 15.71% and for 5 years is at 14.87%. Such growth rates are crucial as they reflect the company's strategic financial planning towards sustainable shareholder returns.
| Time | Growth |
|---|---|
| 3 years | 15.71% |
| 5 years | 14.87% |
The average dividend growth is 14.87% over 5 years. This shows moderate but steady dividend growth.
💸 Payout Ratio
The payout ratios are an essential financial metric to assess dividend sustainability, with lower values typically indicative of safety and room for growth. Visa maintains an earnings-based payout ratio of 22% and a free cash flow-based ratio of 20%.
| Key figure | Ratio |
|---|---|
| EPS-based | 22% |
| Free cash flow-based | 20% |
With an EPS payout ratio of 22% and FCF ratio at 20%, Visa maintains a conservative and sustainable approach to dividends.
🧾 Cashflow & Capital Efficiency
In analyzing cashflows and capital efficiency, Visa's financial strength is evidenced by robust Free Cash Flow generation relative to its capital expenditures and other fiscal requirements. This positions Visa as a financially stable entity, capable of innovating and investing in market opportunities while rewarding shareholders.
| Year | 2025 | 2024 | 2023 |
|---|---|---|---|
| Free Cash Flow Yield | 3.25% | 3.40% | 4.11% |
| Earnings Yield | 3.03% | 3.60% | 3.60% |
| CAPEX to Operating Cash Flow | 6.43% | 6.30% | 5.10% |
| Stock-based Compensation to Revenue | 2.24% | 2.37% | 2.34% |
| Free Cash Flow / Operating Cash Flow Ratio | 93.57% | 93.70% | 94.90% |
Visa’s cashflow stability and capital efficiency metrics underscore a strong operational foundation, allowing for consistent dividend payouts and potential for growth.
📉 Balance Sheet & Leverage Analysis
Analyzing Visa's balance sheet offers insights into its leverage strategy and financial resilience, marked by moderate debt levels and high coverage ratios, ensuring sound financial health and independence in capital markets.
| Year | 2025 | 2024 | 2023 |
|---|---|---|---|
| Debt-to-Equity | 66.40% | 53.24% | 52.83% |
| Debt-to-Assets | 25.27% | 22.05% | 22.61% |
| Debt-to-Capital | 39.90% | 34.74% | 34.57% |
| Net Debt to EBITDA | 19.29% | 34.63% | 18.46% |
| Current Ratio | 1.08 | 1.28 | 1.45 |
| Quick Ratio | 1.08 | 1.28 | 1.45 |
| Financial Leverage | 2.63 | 2.41 | 2.34 |
Visa's leverage metrics confirm a well-balanced approach, maintaining manageable debts and sufficient liquidity to secure financial obligations and fund innovative growth.
🔍 Fundamental Strength & Profitability
Visa's strong fundamentals are represented by high returns on equity and assets, complemented by substantial profit margins. These indicators affirm Visa's effectiveness in resource utilization and its vast profitability potential amid expanding its market presence.
| Year | 2025 | 2024 | 2023 |
|---|---|---|---|
| Return on Equity | 52.91% | 50.45% | 44.60% |
| Return on Assets | 20.13% | 20.89% | 19.09% |
| Net Margin | 50.15% | 54.95% | 52.90% |
| EBIT Margin | 61.96% | 68.35% | 66.40% |
| EBITDA Margin | 65.01% | 71.23% | 69.29% |
| Gross Margin | 80.36% | 80.40% | 79.89% |
| R&D to Revenue | 0% | 0% | 0% |
Visa’s profitability and fundamental strength are underscored by strong returns and exceptional margins, reflecting strategic efficiency and sustainable growth trajectories.
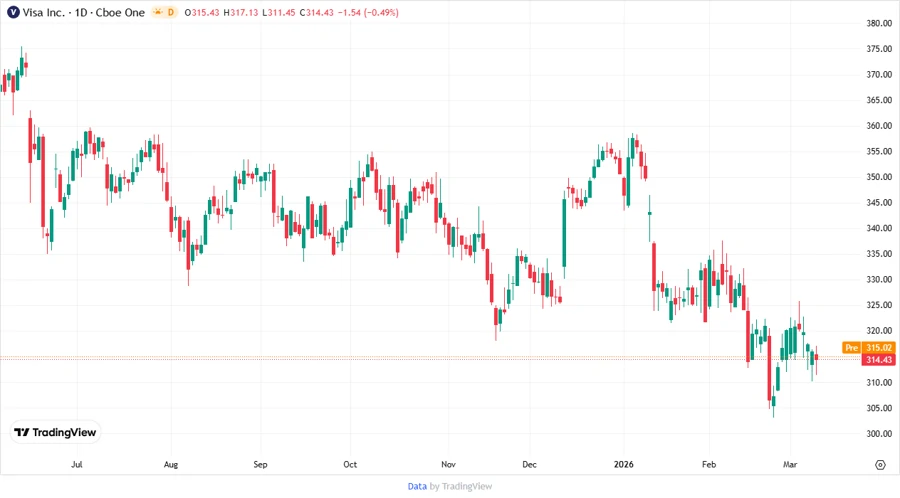
💹 Price Development
✅ Dividend Scoring System
| Category | Score | Representation |
|---|---|---|
| Dividend yield | 3 | |
| Dividend Stability | 5 | |
| Dividend growth | 4 | |
| Payout ratio | 5 | |
| Financial stability | 5 | |
| Dividend continuity | 5 | |
| Cashflow Coverage | 4 | |
| Balance Sheet Quality | 5 |
Total Score: 36/40
⭐ Rating
In conclusion, Visa Inc. boasts an exceptional dividend profile characterized by stability, strong financial metrics, and strategic growth potential. It provides a moderate yield, robust capital management, and reliable cash flow, making it an excellent choice for risk-averse investors seeking long-term dividend growth. Investing in Visa aligns with a strategy focused on stable, consistent returns, underpinned by enduring financial strength and operational excellence.
Smart Data Insight
Master the Perfect Entry & Exit for this Stock
Don't leave your profits to chance. Historically, this stock follows specific seasonal patterns that institutional traders use to maximize returns.
- ✅ Identify the "Golden Buying Window"
- ✅ Avoid high-risk correction cycles
- ✅ Backtested data from the last 20+ years