June 29, 2025 a 12:46 pm

V: Dividend Analysis - Visa Inc.
Visa Inc. is a global leader in the digital payment industry. With an 18-year consistent dividend history and robust fundamentals, Visa provides a reliable investment for dividend-seeking investors. Key dividend growth metrics indicate a steady increase over the years, making Visa a potentially rewarding long-term dividend stock. ⚖️ Furthermore, the company's sound financial metrics support its strategic growth amidst economic uncertainties.
Overview
Visa Inc. is renowned for its consistent dividend payments and robust financial health. Below is a concise snapshot of the dividend-related metrics:
| Metric | Value |
|---|---|
| Sector | Financial Services |
| Dividend yield | 0.64% |
| Current dividend per share | 2.60 USD |
| Dividend history | 18 years |
| Last cut or suspension | None |
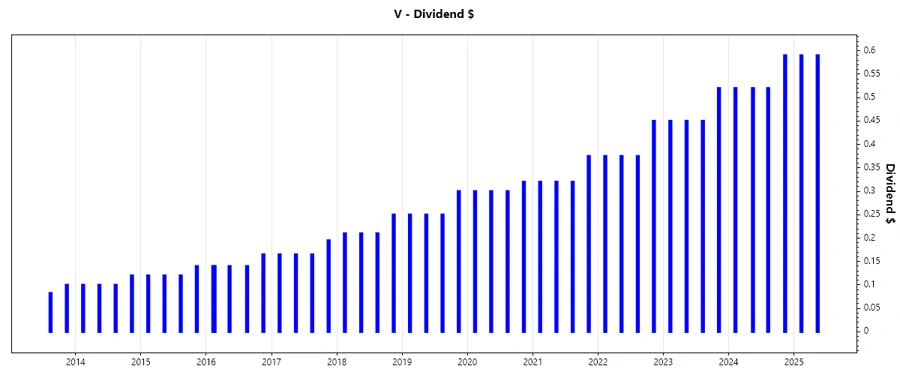
Dividend History 🗣️
Visa's 18-year dividend history underscores its commitment to rewarding shareholders. The following table highlights the recent dividend developments, reflecting the company's consistent performance.
| Year | Dividend per Share (USD) |
|---|---|
| 2025 | 1.18 |
| 2024 | 2.15 |
| 2023 | 1.87 |
| 2022 | 1.575 |
| 2021 | 1.335 |
Dividend Growth 📈
The dividend growth rate is a key indicator of a company's ability to increase shareholder value. Visa showcases a solid 3- and 5-year growth trajectory that highlights its dividend enhancement strategy.
| Time | Growth |
|---|---|
| 3 years | 17.22% |
| 5 years | 15.41% |
The average dividend growth is 15.41% over 5 years. This shows moderate but steady dividend growth, enhancing the long-term investment appeal of Visa Inc.
Payout Ratio ✅
Payout ratios provide insight into dividend sustainability. Visa maintains a disciplined approach to its dividend payouts, as evidenced below:
| Key figure | Ratio |
|---|---|
| EPS-based | 25.51% |
| Free cash flow-based | 24.60% |
The low payout ratios—25.51% (EPS) and 24.60% (FCF)—suggest that Visa has ample room to maintain or increase its dividend payouts, which is favorable for potential dividend growth.
Cashflow & Capital Efficiency 📉
Efficient use of cash and capital is critical for sustaining dividend payments over the long term. Below is an evaluation of Visa's cash flow efficiency metrics:
| Metric | 2022 | 2023 | 2024 |
|---|---|---|---|
| Free Cash Flow Yield | 6.10% | 5.29% | 4.19% |
| Earnings Yield | 5.10% | 4.64% | 4.43% |
| CAPEX to Operating Cash Flow | 5.15% | 5.10% | 6.31% |
| Stock-based Compensation to Revenue | 2.05% | 2.34% | 2.37% |
| Free Cash Flow / Operating Cash Flow Ratio | 94.85% | 94.90% | 93.70% |
Visa's cash flow stability and capital efficiency metrics indicate strong operating performance, ensuring that the company can continue to fund its operations and dividends effectively.
Balance Sheet & Leverage Analysis 🏦
A strong balance sheet is vital for withstanding economic downturns. The following shows Visa's leverage and liquidity status:
| Metric | 2022 | 2023 | 2024 |
|---|---|---|---|
| Debt-to-Equity | 0.631 | 0.528 | 0.532 |
| Debt-to-Assets | 0.263 | 0.226 | 0.220 |
| Debt-to-Capital | 0.387 | 0.346 | 0.347 |
| Net Debt to EBITDA | 34.61% | 18.46% | 34.63% |
| Current Ratio | 1.448 | 1.452 | 1.283 |
| Quick Ratio | 1.448 | 1.452 | 1.283 |
| Financial Leverage | 2.40 | 2.34 | 2.41 |
Visa's strong balance sheet, with healthy liquidity ratios and controlled leverage, demonstrates financial robustness capable of supporting future endeavors and dividend consistency.
Fundamental Strength & Profitability 📊
High profitability and efficient operation underpin Visa's ability to distribute dividends. Here is an analysis of Visa's profitability ratios:
| Metric | 2022 | 2023 | 2024 |
|---|---|---|---|
| Return on Equity | 42.04% | 44.60% | 50.45% |
| Return on Assets | 17.49% | 19.09% | 20.89% |
| Margins: Net, EBIT, EBITDA, Gross | Net: 51.03%, EBIT: 63.71%, EBITDA: 66.65%, Gross: 80.44% | Net: 52.90%, EBIT: 66.40%, EBITDA: 69.29%, Gross: 79.89% | Net: 54.95%, EBIT: 68.35%, EBITDA: 71.23%, Gross: 80.40% |
| Research & Development to Revenue | 0% | 0% | 0% |
Visa excels in profitability metrics, ensuring robust performance. The improvements year-over-year in profit margins and returns enhance its dividend-paying capacity.
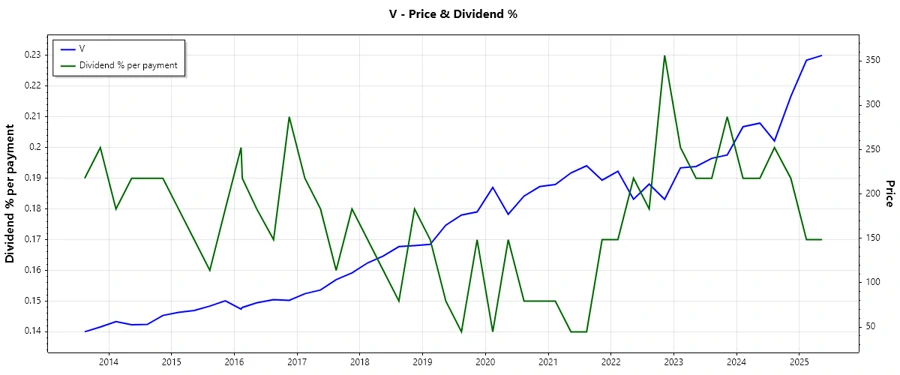
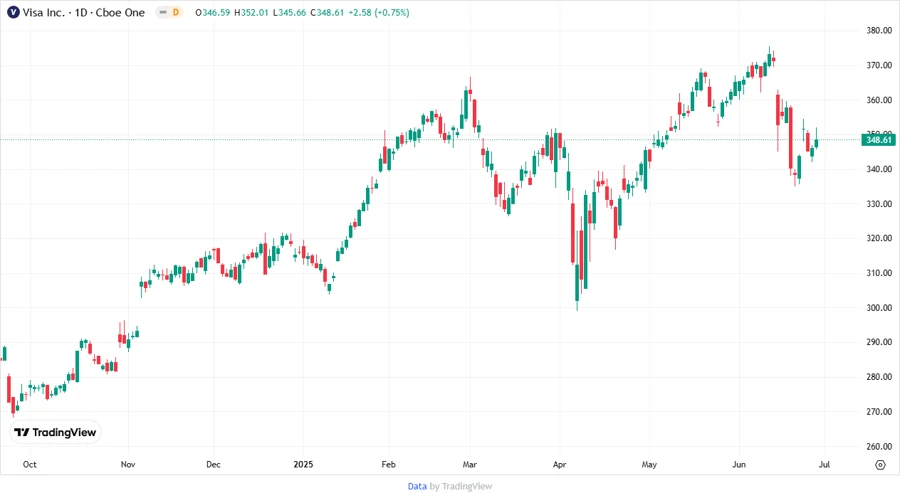
Price Development 🛒
Dividend Scoring System 🎯
This scoring system evaluates various aspects of Visa's dividend policies:
| Category | Score | Visual |
|---|---|---|
| Dividend yield | 3 | |
| Dividend Stability | 5 | |
| Dividend growth | 4 | |
| Payout ratio | 5 | |
| Financial stability | 5 | |
| Dividend continuity | 5 | |
| Cashflow Coverage | 4 | |
| Balance Sheet Quality | 5 |
Overall Score: 36/40
Rating 🌟
Visa Inc. is rated highly as a dividend-paying stock, with outstanding performance in dividend stability, financial strength, and payout ratios. It is recommended for investors seeking moderate growth and consistent income.
Smart Data Insight
Master the Perfect Entry & Exit for this Stock
Don't leave your profits to chance. Historically, this stock follows specific seasonal patterns that institutional traders use to maximize returns.
- ✅ Identify the "Golden Buying Window"
- ✅ Avoid high-risk correction cycles
- ✅ Backtested data from the last 20+ years