June 05, 2025 a 03:31 am

📊 Dividend Analysis - Visa Inc.
Visa Inc. demonstrates a consistent dividend growth history, indicative of strong financial health and shareholder value prioritization. With its current dividend yield at 0.64%, Visa remains a stable source of income amidst market fluctuations. The company has maintained consistent dividend payments over 18 years without cuts, suggesting strong business resilience.
🗣️ Overview
Visa Inc. operates in the financial services sector, known for its robust cash-generating capacity and brand strength, aspects that contribute to a reliable dividend profile.
| Metric | Value |
|---|---|
| Sector | Financial Services |
| Dividend yield | 0.64 % |
| Current dividend per share | 2.60 USD |
| Dividend history | 18 years |
| Last cut or suspension | None |
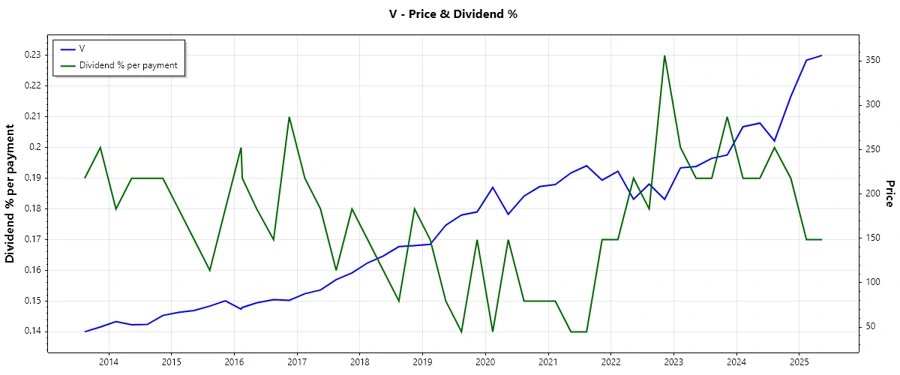
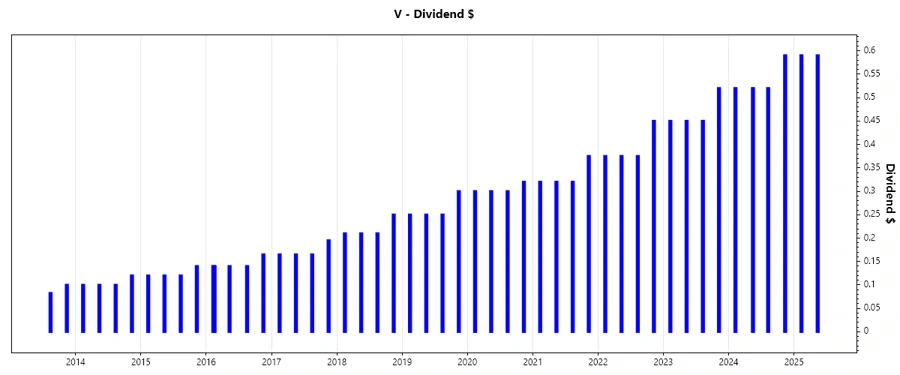
📈 Dividend History
The dividend history of Visa underlines its commitment to shareholders, showcasing resilience in maintaining payouts even through economic turmoils.
| Year | Dividend Per Share (USD) |
|---|---|
| 2025 | 1.18 |
| 2024 | 2.15 |
| 2023 | 1.87 |
| 2022 | 1.575 |
| 2021 | 1.335 |
📈 Dividend Growth
The growth in dividends provides insights into company earnings and cash flow strength, showcasing Visa's 5-year growth rate of 15.41%.
| Time | Growth |
|---|---|
| 3 years | 17.22 % |
| 5 years | 15.41 % |
The average dividend growth is 15.41% over 5 years. This shows moderate but steady dividend growth.
📉 Payout Ratio
The payout ratio is crucial for assessing dividend sustainability. Visa's low EPS payout ratio of 25.51% indicates a conservative approach, ensuring dividends are well-covered by earnings.
| Key Figure | Ratio |
|---|---|
| EPS-based | 25.51 % |
| Free cash flow-based | 24.60 % |
The low payout ratios reflect Visa's strong capacity to sustain and increase dividends, balancing shareholder returns with business reinvestment.
🧾 Cashflow & Capital Efficiency
A strong cash flow position underscores operational efficiency and the capacity to fund dividends and growth initiatives. Visa's continuing free cash flow yield suggests prudent financial management.
| 2024 | 2023 | 2022 | |
|---|---|---|---|
| Free Cash Flow Yield | 4.19% | 5.29% | 6.10% |
| Earnings Yield | 4.43% | 4.64% | 5.10% |
| CAPEX/Operating Cash Flow | 6.31% | 5.10% | 5.15% |
| Stock-based Compensation/Revenue | 2.37% | 2.34% | 2.05% |
| Free Cash Flow / Operating Cash Flow Ratio | 93.70% | 95.00% | 94.85% |
Visa's cash flow metrics showcase a strong position, offering stability for shareholder distributions while supporting business expansion.
🧾 Balance Sheet & Leverage Analysis
Understanding the leverage metrics informs about the company's debt management and capacity to meet obligations. Visa's ratios reflect effective risk management with a balanced debt profile.
| Metric | 2024 | 2023 | 2022 |
|---|---|---|---|
| Debt-to-Equity | 0.53 | 0.53 | 0.63 |
| Debt-to-Assets | 0.22 | 0.23 | 0.26 |
| Debt-to-Capital | 0.35 | 0.35 | 0.39 |
| Net Debt to EBITDA | 0.35 | 0.18 | 0.35 |
| Current Ratio | 1.28 | 1.45 | 1.45 |
| Quick Ratio | 1.28 | 1.45 | 1.45 |
| Financial Leverage | 2.41 | 2.34 | 2.40 |
Visa’s balance sheet indicates a solid financial standing with manageable leverage, contributing to its ability to provide stable dividends and invest in growth.
📉 Fundamental Strength & Profitability
Profitability metrics are vital in assessing how effectively a company converts sales into profits. Visa’s steady margins reflect robust operational efficiency and effective management.
| Metric | 2024 | 2023 | 2022 |
|---|---|---|---|
| Return on Equity | 50.45% | 44.60% | 42.04% |
| Return on Assets | 20.89% | 19.09% | 17.49% |
| Net Margin | 54.95% | 52.90% | 51.03% |
| EBIT Margin | 68.35% | 66.40% | 63.71% |
| EBITDA Margin | 71.23% | 69.29% | 66.65% |
| Gross Margin | 80.40% | 79.89% | 80.44% |
Visa's solid profitability measures are indicative of a well-optimized operating model capable of sustaining growth and enhancing shareholder value.
📈 Price Development
✅ Dividend Scoring System
The following scoring assesses various dividend and financial stability metrics.
| Category | Score | |
|---|---|---|
| Dividend yield | 3 | |
| Dividend Stability | 5 | |
| Dividend growth | 4 | |
| Payout ratio | 5 | |
| Financial stability | 5 | |
| Dividend continuity | 5 | |
| Cashflow Coverage | 5 | |
| Balance Sheet Quality | 5 |
Total Score: 37/40
🗣️ Rating
Visa Inc.'s outstanding consistency in dividend distribution, coupled with low payout ratios and strong financial metrics, makes it an attractive opportunity for investors seeking stable returns and growth potential. The company's financial stance ensures robust dividend sustainability, earning it a high rating in its sector.
Smart Data Insight
Master the Perfect Entry & Exit for this Stock
Don't leave your profits to chance. Historically, this stock follows specific seasonal patterns that institutional traders use to maximize returns.
- ✅ Identify the "Golden Buying Window"
- ✅ Avoid high-risk correction cycles
- ✅ Backtested data from the last 20+ years