November 09, 2025 a 04:03 am


VZ: Trend and Support & Resistance Analysis - Verizon Communications Inc.
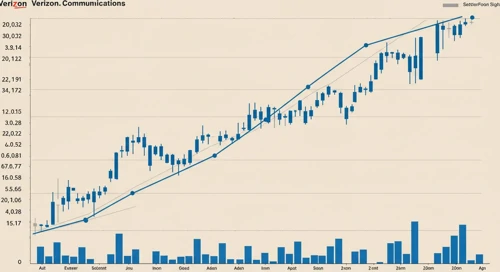
The recent analysis of Verizon Communications Inc. (VZ) shows a complex trend progression. Historical data indicate fluctuations across several months, highlighting a recent decline in stock prices. With a substantial global presence in communications and technology, Verizon faces industry challenges but benefits from its expansive customer base. It’s essential to assess these dynamics critically.
Trend Analysis
| Date | Close Price | Trend |
|---|---|---|
| 2025-11-07 | $40.03 | ▼ |
| 2025-11-06 | $39.82 | ▼ |
| 2025-11-05 | $39.69 | ▼ |
| 2025-11-04 | $39.32 | ▼ |
| 2025-11-03 | $39.47 | ▼ |
| 2025-10-31 | $39.74 | ▼ |
| 2025-10-30 | $38.96 | ▼ |
The analysis of EMA20 and EMA50 reveals a sustained downtrend over the recent period, with EMA20 consistently below EMA50. This pattern indicates bearish market tendencies.
Support and Resistance
| Zone Type | From | To |
|---|---|---|
| Support | $38.50 | $39.00 |
| Support | $39.50 | $40.00 |
| Resistance | $41.50 | $42.00 |
| Resistance | $42.50 | $43.00 |
The current price of Verizon lies in the support zone of $39.50 to $40.00, suggesting potential stabilization or bounce back from this level. However, if this area is breached, a drop towards $38.50 - $39.00 cannot be ruled out.
Conclusion
The analysis of Verizon Communications Inc. stock indicates a prevailing bearish trend. The proximity to support levels offers potential rebound opportunities. Remaining vigilant in light of the company's market position and external factors is advisable. Opportunities may arise from these support zones, yet risks persist as industry challenges continue. The significance for analysts lies in the detailed monitoring of EMA interactions and critical price zones. Strategically, this positions Verizon for investors seeking undervalued opportunities with a keen eye on market movements.
Smart Data Insight
Master the Perfect Entry & Exit for this Stock
Don't leave your profits to chance. Historically, this stock follows specific seasonal patterns that institutional traders use to maximize returns.
- ✅ Identify the "Golden Buying Window"
- ✅ Avoid high-risk correction cycles
- ✅ Backtested data from the last 20+ years