July 12, 2025 a 08:15 am

VZ: Trend and Support & Resistance Analysis - Verizon Communications Inc.
Verizon Communications Inc. offers a range of technology and telecommunications services globally. Recently, its stock has shown signs of both stabilization and fluctuation, with subtle shifts in the market. The technical indicators and support/resistance zones for Verizon's stock point towards significant levels of trading activity and potential trend reversals. This analysis aims to provide insights into these patterns and the implications for traders and investors.
Trend Analysis
The recent performance of Verizon Communications Inc. stock indicates a dynamic market behavior. The calculation of the Exponential Moving Averages (EMAs) over 20 and 50 days aids in determining the current trend. Based on the EMA values:
- EMA20: Fluctuating around the short-term movements in stock price.
- EMA50: Smoothing out longer-term trends.
| Date | Close Price | Trend |
|---|---|---|
| 2025-07-11 | 41.62 | ▼ |
| 2025-07-10 | 42.03 | ▲ |
| 2025-07-09 | 42.61 | ▲ |
| 2025-07-08 | 43.06 | ▲ |
| 2025-07-07 | 42.80 | ▲ |
| 2025-07-03 | 43.55 | ▲ |
| 2025-07-02 | 43.59 | ▲ |
Overall, the recent trend suggests a slight upward movement in stock price, reflecting investor confidence. This suggests an ⬆️ upward trend.
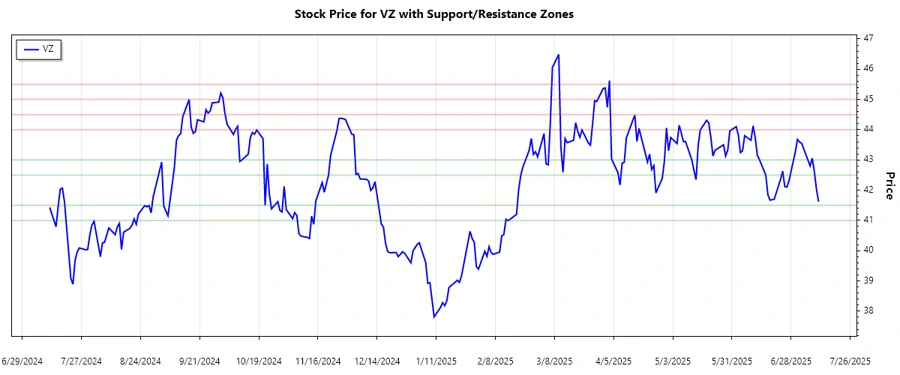
Support and Resistance
Analysis of the recent price action for Verizon indicates the following support and resistance zones based on historical data points:
| Zone Type | From | To |
|---|---|---|
| Support | $41.00 | $41.50 |
| Support | $42.50 | $43.00 |
| Resistance | $44.00 | $44.50 |
| Resistance | $45.00 | $45.50 |
Currently, the stock is trading within the support range of $42.50 - $43.00, indicating buying interest.
Conclusion
Verizon Communications Inc. stock is currently exhibiting a slight bullish trend, with potential upward momentum based on the calculated EMA values. The support zones suggest strong buying interest within a range, thereby reducing the risk of sudden price drops. However, resistance levels might pose challenges. Analysts and traders should monitor volume and market sentiment closely to navigate potential risks and leverage emerging opportunities.
Smart Data Insight
Master the Perfect Entry & Exit for this Stock
Don't leave your profits to chance. Historically, this stock follows specific seasonal patterns that institutional traders use to maximize returns.
- ✅ Identify the "Golden Buying Window"
- ✅ Avoid high-risk correction cycles
- ✅ Backtested data from the last 20+ years