June 21, 2026 a 05:15 am

VZ: Fibonacci Analysis - Verizon Communications Inc.
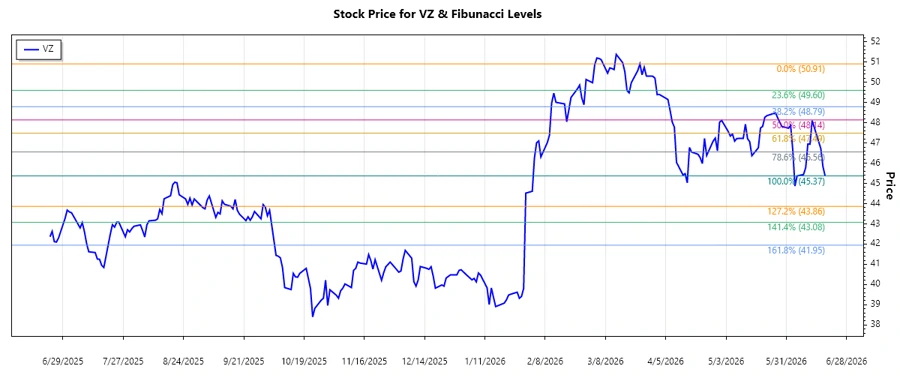
The recent trend analysis of Verizon Communications Inc. (VZ) indicates a dominant downward trend over the past few months. This trend could be attributed to multiple market factors, including competitive pressures and technological advancements within the telecommunications sector. As Verizon navigates through these challenges, investors should be mindful of potential supports or resistances identified through technical analysis indicators such as Fibonacci retracement levels.
Fibonacci Analysis
| Aspect | Details |
|---|---|
| Start Date of Trend | 2026-02-26 |
| End Date of Trend | 2026-06-18 |
| High Price & Date | $50.91 on 2026-03-24 |
| Low Price & Date | $45.37 on 2026-06-18 |
| Fibonacci Level | Price |
|---|---|
| 0.236 | $46.63 |
| 0.382 | $47.54 |
| 0.5 | $48.14 |
| 0.618 | $48.75 |
| 0.786 | $49.57 |
The current price of the stock is in the 0.236 Fibonacci retracement zone. This suggests a potential retracement to higher levels, though further confirmation is needed to validate any reversal or continuation of the trend. Technically, this area might act as support or resistance depending on investor sentiment and broader market conditions.
Conclusion
Verizon Communications Inc. is currently navigating a downward trend, but the presence of support levels at key Fibonacci retracement zones suggests potential stabilization. While the broader telecommunications landscape remains challenging, strategic investments in technology and network expansion could offer growth opportunities for Verizon. However, competitive pressures and regulatory uncertainties pose significant risks. Investors should closely monitor further technical and fundamental developments to make informed decisions, as the presence of robust support or resistance levels might dictate future price movements.
Smart Data Insight
Master the Perfect Entry & Exit for this Stock
Don't leave your profits to chance. Historically, this stock follows specific seasonal patterns that institutional traders use to maximize returns.
- ✅ Identify the "Golden Buying Window"
- ✅ Avoid high-risk correction cycles
- ✅ Backtested data from the last 20+ years