March 13, 2026 a 05:15 am
VZ: Fibonacci Analysis - Verizon Communications Inc.
Verizon Communications Inc., a major player in the communication sector, exhibits a solid market position. With its extensive network connectivity offerings, it caters to a diverse range of customers, including consumers and businesses. This analysis aims to understand the recent pricing trend using technical analysis tools like Fibonacci retracements. Successfully identifying these trends can inform potential investment decisions.
Fibonacci Analysis
| Data Points | Details |
|---|---|
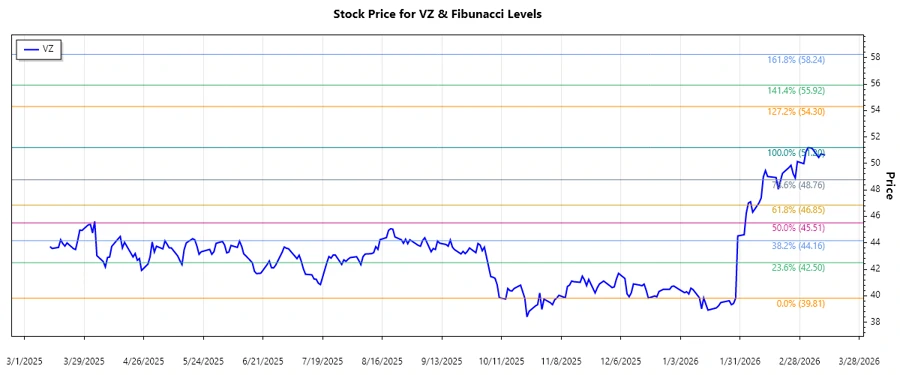
| Start Date | 2026-01-29 |
| End Date | 2026-03-06 |
| High Price & Date | $51.2 on 2026-03-04 |
| Low Price & Date | $39.81 on 2026-01-29 |
Calculated Fibonacci Levels
| Retracement Level | Price |
|---|---|
| 0.236 | $44.09 |
| 0.382 | $45.97 |
| 0.5 | $47.50 |
| 0.618 | $49.03 |
| 0.786 | $50.78 |
The current price of the stock is at $50.63, which is within the 0.786 Fibonacci retracement level. Technically, this indicates a potential resistance area, where a price reversal might occur, suggesting caution for bullish investors.
Conclusion
The analysis of Verizon's recent price activities highlights a significant uptrend, identifying key retracement levels that can indicate potential support or resistance. With the current trading price near the 0.786 retracement level, this signals possible hesitation in the upward momentum. While this could provide a short-term resistance, the broader upward trend suggests continued strength. Investors should weigh this optimism against the potential for short-term corrections. The strength of Fibonacci retracement levels in technical analysis lies in their ability to highlight critical price points, assisting in more informed investment decisions.