February 03, 2026 a 03:15 pm
VZ: Fibunacci Analysis - Verizon Communications Inc.
Verizon Communications Inc.'s stock has shown fluctuating movements over the past months, reflecting the dynamic nature of the telecommunications industry amidst technological advancements and market competition. Given the stock's recent trend, technical indicators might provide a clearer projection of potential price levels. Investors should closely watch for patterns that could signal changes in the company's market performance.
Fibonacci Analysis
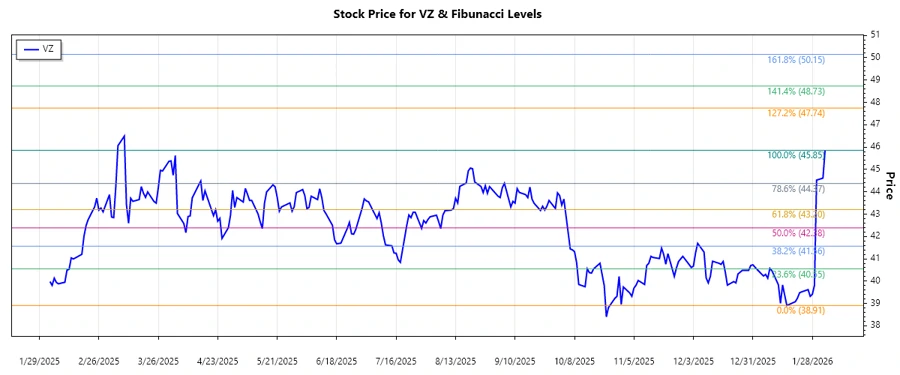
| Start Date | End Date | High (Price & Date) | Low (Price & Date) | Fibonacci Levels |
|---|---|---|---|---|
| 2025-10-07 | 2026-02-03 | $45.855 on 2026-02-03 | $38.91 on 2026-01-16 |
0.236 - $43.86 0.382 - $42.56 0.5 - $41.38 0.618 - $40.20 0.786 - $38.58 |
The current price as of the last update is within the 0.236 retracement level, suggesting a potential support area where the price might consolidate.
Technically, this indicates that the recent pullback might find stability or might reverse if support holds. If breached, further downside could be explored.
Conclusion
The analyzed trend suggests Verizon is in a potential retracement phase, with key support levels identified. Investors should consider the company's solid fundamentals against the backdrop of potential market volatility. There is a chance for further short-term downside if support levels do not hold. However, given the company's market position, opportunities for recovery and growth remain. Analysts will continue to evaluate how these technical signals align with broader market trends and economic conditions.