September 19, 2025 a 05:16 am

VZ: Fibonacci Analysis - Verizon Communications Inc.
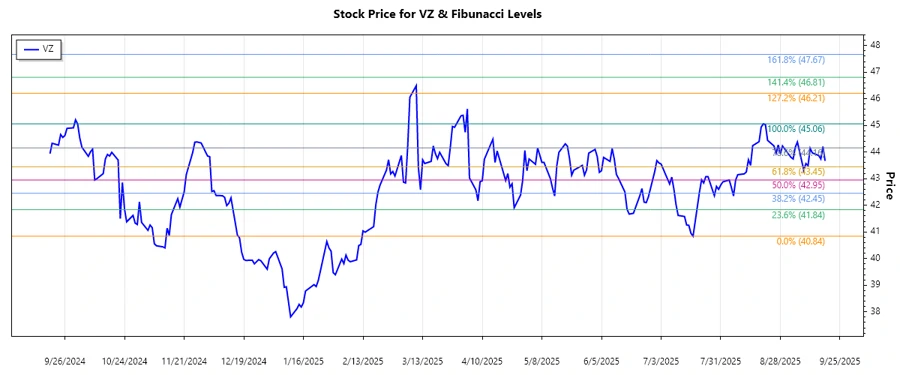
Verizon Communications Inc., a major player in the communications sector, has shown a consistent capability to weather market fluctuations. Recently, an upward trend has been observed, suggesting potential positive movement in stock prices. While facing tough competition in various segments, Verizon continues to hold a steady market position with diverse service offerings. The recent technical analysis indicates potential opportunities for investors to capitalize on ongoing upward momentum.
Fibonacci Analysis
The analysis was conducted over a period where an upward trend was identified, starting from a low point to a recent high.
| Start Date | End Date | High Price (Date) | Low Price (Date) |
|---|---|---|---|
| 2025-07-18 | 2025-08-20 | $45.06 (2025-08-20) | $40.84 (2025-07-18) |
The following Fibonacci levels were calculated for the specified trend:
| Fibonacci Level | Price Level |
|---|---|
| 0.236 | $43.90 |
| 0.382 | $43.06 |
| 0.5 | $42.95 |
| 0.618 | $42.12 |
| 0.786 | $41.14 |
Currently, the stock price of $43.67 is within the 0.236 retracement zone, suggesting a possible near-term support level. This level might act as a stabilizing factor, providing investors a point to consider additional investments.
Conclusion
The upward trend suggests a stable investment opportunity in Verizon, with technical indicators pointing towards solid support levels. Investors should be cautious, however, as external market factors can cause volatility. While the current retracement level offers a base for potential growth, careful monitoring of further price movements is advised. Verizon's diverse offerings and large consumer base provide a strong foundation for future growth, despite stiff competition. Risks remain, but strategic investments at current levels could lead to favorable outcomes. Technical analysis supports viewing Verizon as a viable long-term portfolio addition.
Smart Data Insight
Master the Perfect Entry & Exit for this Stock
Don't leave your profits to chance. Historically, this stock follows specific seasonal patterns that institutional traders use to maximize returns.
- ✅ Identify the "Golden Buying Window"
- ✅ Avoid high-risk correction cycles
- ✅ Backtested data from the last 20+ years