
August 24, 2025 a 05:15 am
VZ: Fibonacci Analysis - Verizon Communications Inc.
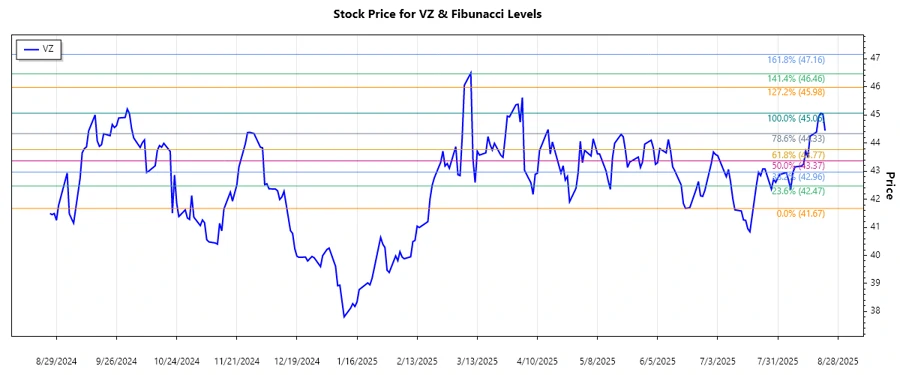
Verizon Communications Inc. is currently experiencing an upward market trend, indicating a potential positive outlook for the stock. As a telecom giant, it remains an attractive investment option due to its robust infrastructure and consumer base. However, investors should remain cautious of potential market fluctuations and competitive pressures.
Fibonacci Analysis
| Details | Data |
|---|---|
| Start Date of Trend | 2025-06-18 |
| End Date of Trend | 2025-08-22 |
| High Price (Date) | 45.06 (2025-08-20) |
| Low Price (Date) | 41.67 (2025-06-18) |
Fibonacci Retracement Levels
| Level | Price |
|---|---|
| 0.236 | 44.20 |
| 0.382 | 43.64 |
| 0.5 | 43.36 |
| 0.618 | 43.08 |
| 0.786 | 42.74 |
The current price, as of the latest update, is 44.44, which sits just above the 0.236 retracement level. This may indicate a strong support level forming at 44.20, potentially offering a continuation of the upward momentum.
Conclusion
The recent upward trend in Verizon's stock suggests a positive momentum, making it an appealing investment for those seeking stability in the telecom sector. While the current price is hovering around a significant retracement level, signaling potential support, investors should be mindful of market volatility and regulatory challenges. The retracement levels can act as reference points for potential entry or exit strategies, emphasizing the importance of monitoring ongoing market conditions.
Smart Data Insight
Master the Perfect Entry & Exit for this Stock
Don't leave your profits to chance. Historically, this stock follows specific seasonal patterns that institutional traders use to maximize returns.
- ✅ Identify the "Golden Buying Window"
- ✅ Avoid high-risk correction cycles
- ✅ Backtested data from the last 20+ years