
May 12, 2026 a 11:31 am
📊 VZ: Dividend Analysis - Verizon Communications Inc.
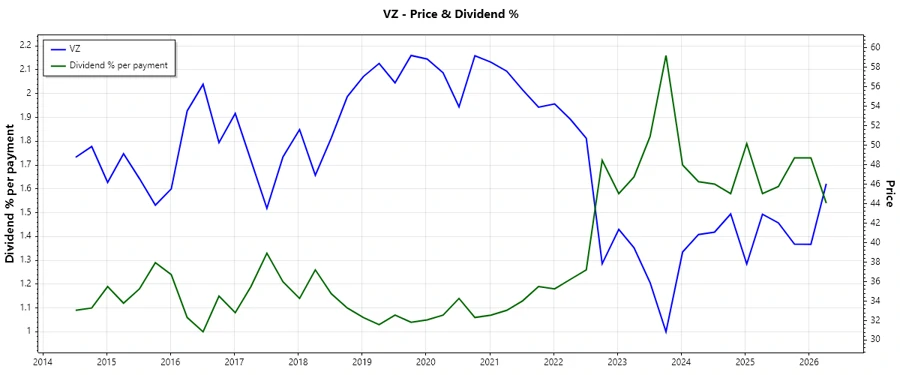
Verizon Communications Inc. stands as a cornerstone in the telecommunications sector, offering an attractive dividend yield and a storied history of consistent payments. With a yield of approximately 6%, its dividends are appealing to income-focused investors. While recent growth has been modest, the company's enduring commitment to returning value to shareholders is noteworthy.
🗣️ Overview
Verizon Communications Inc. is renowned for its strong market presence in the telecommunications sector. Investors can take solace in the knowledge of its substantial and consistent dividend history.
| Criteria | Value |
|---|---|
| Sector | Telecommunications |
| Dividend yield | 6.01% |
| Current dividend per share | 2.72 USD |
| Dividend history | 43 years |
| Last cut or suspension | None |
📉 Dividend History
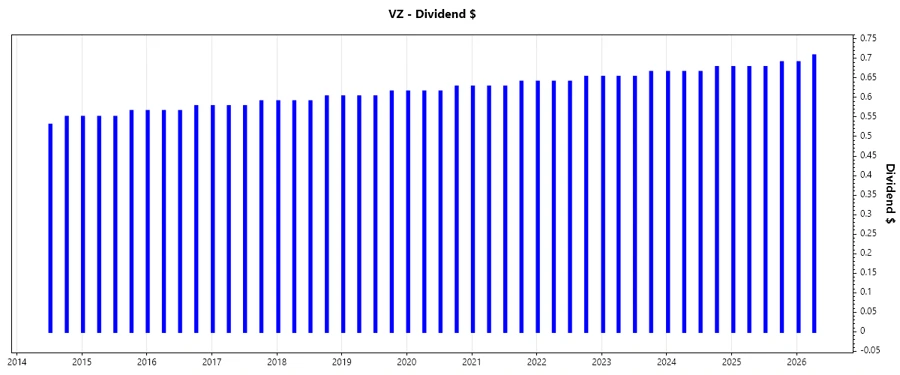
Verizon's dividend history is pivotal, serving as a testament to its commitment to rewarding shareholders consistently over the decades. This history is crucial for assessing the reliability of future dividends, making Verizon a noteworthy player for dividend seekers.
| Year | Dividend Per Share (USD) |
|---|---|
| 2026 | 1.3975 |
| 2025 | 2.7225 |
| 2024 | 2.6725 |
| 2023 | 2.6225 |
| 2022 | 2.5725 |
📈 Dividend Growth
Dividend growth is a vital component, indicating a company's commitment to increasing shareholder returns over time. Assessments based on 3-year and 5-year growth percentages highlight Verizon's ability to incrementally enhance value for its investors.
| Time | Growth |
|---|---|
| 3 years | 1.91% |
| 5 years | 1.95% |
The average dividend growth is 1.95% over 5 years. This shows moderate but steady dividend growth, reflective of Verizon's balanced approach to dividend increments.
✅ Payout Ratio
Payout ratios are critical in evaluating the sustainability of dividends. They provide insight into the proportion of earnings and cash flows paid as dividends. A balance must be maintained to ensure continued growth and shareholder returns.
| Key figure | Ratio |
|---|---|
| EPS-based | 65.88% |
| Free cash flow-based | 56.57% |
The 65.88% EPS payout ratio indicates a sound balance, allowing for reinvestment while maintaining generous dividends. Similarly, the 56.57% FCF payout ratio affirms the dividends' sustainability.
🔍 Cashflow & Capital Efficiency
Cash flow is vital for sustaining operations and growth investments. Evaluating capital efficiency ratios helps ascertain the financial health and potential of Verizon to pursue strategic initiatives while covering its dividend commitments.
| Year | 2023 | 2024 | 2025 |
|---|---|---|---|
| Free Cash Flow Yield | 11.78% | 11.22% | 11.69% |
| Earnings Yield | 7.32% | 10.38% | 9.98% |
| CAPEX to Operating Cash Flow | 50.08% | 48.74% | 45.79% |
| Stock-based Compensation to Revenue | 0% | 0% | 0% |
| Free Cash Flow / Operating Cash Flow Ratio | 49.92% | 51.26% | 54.19% |
Verizon shows stable cash flows with satisfactory yield ratios. The company's ability to generate free cash flow consistently underpins its dividend strategy and operational funding.
🔒 Balance Sheet & Leverage Analysis
An analysis of the balance sheet provides insights into Verizon's leverage and liquidity. Effective management of debt and assets ensures sustainable operations without compromising financial flexibility.
| Year | 2023 | 2024 | 2025 |
|---|---|---|---|
| Debt-to-Equity | 1.89 | 1.70 | 1.92 |
| Debt-to-Assets | 0.46 | 0.44 | 0.50 |
| Debt-to-Capital | 0.65 | 0.63 | 0.66 |
| Net Debt to EBITDA | 4.31 | 3.45 | 3.80 |
| Current Ratio | 0.69 | 0.63 | 0.91 |
| Quick Ratio | 0.65 | 0.59 | 0.87 |
| Financial Leverage | 4.11 | 3.88 | 3.87 |
Verizon's financial leverage ratios indicate a manageable debt scenario. A balanced approach in managing debt obligations has been observed, though vigilance against increasing leverage is advised.
🌟 Fundamental Strength & Profitability
Profitability ratios underscore Verizon's capability to generate returns on investments and equity. These metrics along with margins highlight the company's efficacy in revenue generation and cost management.
| Year | 2023 | 2024 | 2025 |
|---|---|---|---|
| Return on Equity | 12.57% | 17.64% | 16.44% |
| Return on Assets | 3.05% | 4.55% | 4.25% |
| Margins: Net | 8.67% | 12.99% | 12.43% |
| EBIT | 16.80% | 21.98% | 21.25% |
| EBITDA | 29.96% | 35.26% | 34.53% |
| Gross | 45.88% | 46.59% | 45.64% |
| R&D to Revenue | 0% | 0% | 0% |
Verizon's consistent return ratios affirm its profitability and efficient operational management. Despite zero R&D allocation, strategic investments in network infrastructure may contribute to long-term success.
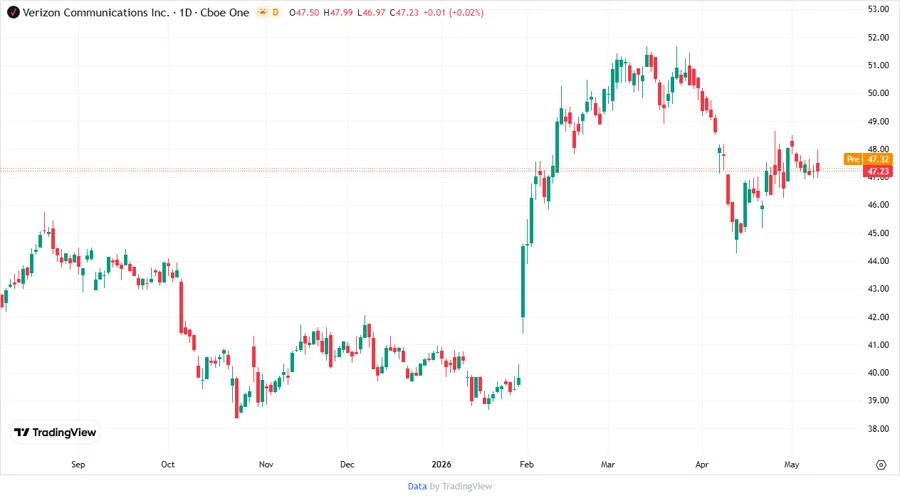
Price Development
✍️ Dividend Scoring System
| Criteria | Score | Visualization |
|---|---|---|
| Dividend Yield | 5 | |
| Dividend Stability | 5 | |
| Dividend Growth | 3 | |
| Payout Ratio | 4 | |
| Financial Stability | 4 | |
| Dividend Continuity | 5 | |
| Cashflow Coverage | 4 | |
| Balance Sheet Quality | 4 |
Overall Score: 34/40
🌟 Rating
In conclusion, Verizon Communications Inc. presents an impressive dividend profile with reliable yield and stability. While growth is moderate, the solid payout ratio and strong cash flow support Verizon's shareholder returns. Its robust financial health indicates dividends are well-covered, making the stock potentially appealing for conservative, income-focused investors.
Smart Data Insight
Master the Perfect Entry & Exit for this Stock
Don't leave your profits to chance. Historically, this stock follows specific seasonal patterns that institutional traders use to maximize returns.
- ✅ Identify the "Golden Buying Window"
- ✅ Avoid high-risk correction cycles
- ✅ Backtested data from the last 20+ years