February 18, 2026 a 07:31 am
📊 VZ: Dividend Analysis - Verizon Communications Inc.
Verizon Communications Inc. has a robust dividend profile, denoting stability and a potential avenue for steady income generation. With a generous dividend yield and a consistent history of payments, Verizon appears committed to rewarding its shareholders. The absence of any recent cuts or suspensions in its dividend history further strengthens its position as a reliable dividend stock.
Overview 📈
| Category | Details |
|---|---|
| Sector | Telecommunications |
| Dividend yield | 5.65% |
| Current dividend per share | 2.72 USD |
| Dividend history | 43 years |
| Last cut or suspension | None |
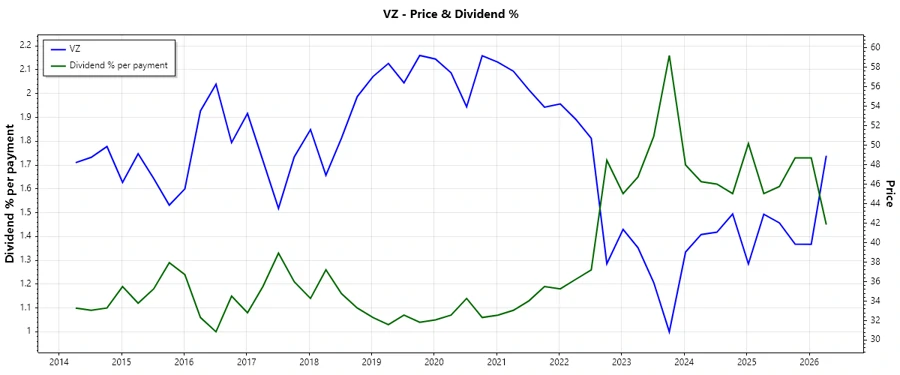
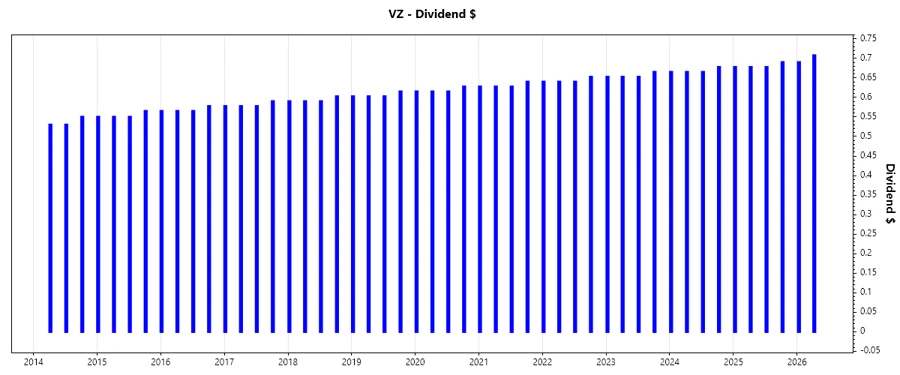
Dividend History 🗣️
Verizon's strong dividend history underscores its commitment to shareholder returns. The consistency of payments over decades makes it a stable choice for income-focused investors.
| Year | Dividend per Share (USD) |
|---|---|
| 2026 | 1.3975 |
| 2025 | 2.7225 |
| 2024 | 2.6725 |
| 2023 | 2.6225 |
| 2022 | 2.5725 |
Dividend Growth ✅
Tracking the growth of dividends is crucial in understanding the financial health and growth potential of Verizon. Consistent moderate growth is a positive indicator.
| Time | Growth |
|---|---|
| 3 years | 1.91% |
| 5 years | 1.94% |
The average dividend growth is 1.94% over 5 years. This shows moderate but steady dividend growth.
Payout Ratio ⚠️
Payout ratios give insight into the sustainability of the dividend payments. A balanced ratio suggests that Verizon can maintain its dividend payments from its earnings.
| Key Figure | Ratio |
|---|---|
| EPS-based | 66.91% |
| Free cash flow-based | 57.89% |
With an EPS payout ratio of 66.91% and FCF ratio of 57.89%, Verizon balances payouts with operational cash flow, indicating a likely continuation of their dividend strategy.
Cashflow & Capital Efficiency 📊
The evaluation of cash flow and capital metrics provides insight into Verizon's operational efficiency and sustainability of free cash flow generation.
| Year | 2025 | 2024 | 2023 |
|---|---|---|---|
| Free Cash Flow Yield | 11.69% | 11.22% | 11.78% |
| Earnings Yield | 9.98% | 10.38% | 7.32% |
| CAPEX/Operating Cash Flow | 46.72% | 48.74% | 50.08% |
| Stock-based Compensation/Revenue | 0% | 0% | 0% |
| Free Cash Flow / Operating Cash Flow Ratio | 54.19% | 51.26% | 49.92% |
Verizon showcases robust cash flow and capital management, indicated by its stable cash flow metrics and efficient allocation of capital.
Balance Sheet & Leverage Analysis 📈
Evaluating the leverage and liquidity is essential for understanding financial stability and risk exposure.
| Year | 2025 | 2024 | 2023 |
|---|---|---|---|
| Debt-to-Equity | 1.92 | 1.70 | 1.89 |
| Debt-to-Assets | 0.50 | 0.44 | 0.46 |
| Debt-to-Capital | 0.66 | 0.63 | 0.65 |
| Net Debt to EBITDA | 3.80 | 3.45 | 4.31 |
| Current Ratio | 0.91 | 0.63 | 0.69 |
| Quick Ratio | 0.87 | 0.59 | 0.65 |
| Financial Leverage | 3.87 | 3.88 | 4.11 |
Verizon maintains a stable leverage profile, although its liquidity ratios highlight potential areas for enhancement in short-term financial strategies.
Fundamental Strength & Profitability 📉
Insights into profitability and efficiency ratios allow for profound understanding of operational performance.
| Year | 2025 | 2024 | 2023 |
|---|---|---|---|
| Return on Equity | 16.44% | 17.64% | 12.56% |
| Return on Assets | 4.25% | 4.55% | 3.05% |
| Margins - Net | 12.43% | 12.99% | 8.67% |
| EBIT Margin | 21.25% | 21.98% | 16.80% |
| EBITDA Margin | 34.53% | 35.26% | 29.96% |
| Gross Margin | 45.64% | 46.59% | 45.88% |
| R&D to Revenue | 0% | 0% | 0% |
Verizon sustains solid profitability credentials, with strong margins and returns, although it dedicates no spending on R&D relative to its revenue.
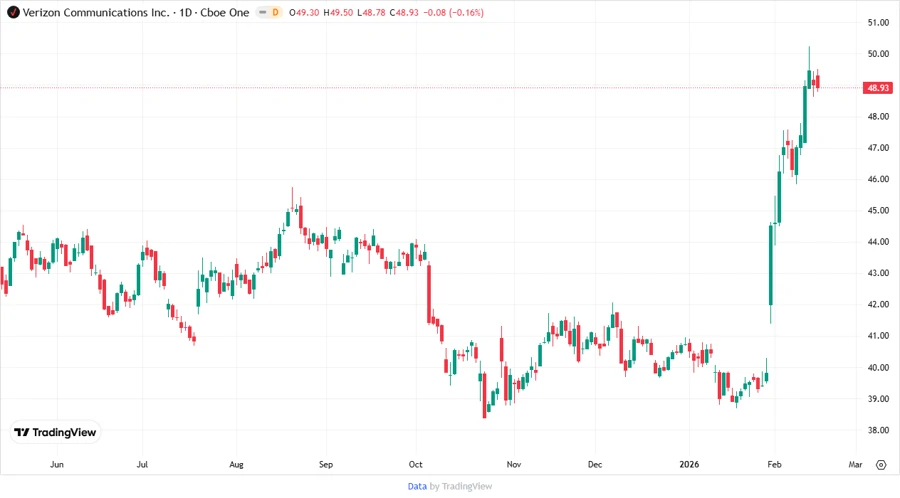
Price Development 🗣️
Dividend Scoring System ✅
| Category | Score | Evaluation |
|---|---|---|
| Dividend yield | 5 | |
| Dividend Stability | 4 | |
| Dividend growth | 3 | |
| Payout ratio | 4 | |
| Financial stability | 4 | |
| Dividend continuity | 5 | |
| Cashflow Coverage | 4 | |
| Balance Sheet Quality | 4 |
Overall Score: 33 out of 40
Rating 🚀
Verizon Communications Inc. receives a robust recommendation for dividend investors seeking steady returns and income stability. While growth in dividend yields remains moderate, the high consistency and sustainability in payouts offer a reliable income stream.