June 08, 2025 a 03:15 am
VTR: Trend and Support & Resistance Analysis - Ventas, Inc.
Ventas, Inc. (VTR) has demonstrated resilience amidst market fluctuations, primarily driven by its strategic positioning at the intersection of healthcare and real estate. The demographic trend of an aging population, combined with a robust portfolio of diversified properties, makes Ventas a noteworthy player in the REIT sector. However, recent downward pressures in share price call for cautious optimism as the company navigates market cycles.
Trend Analysis
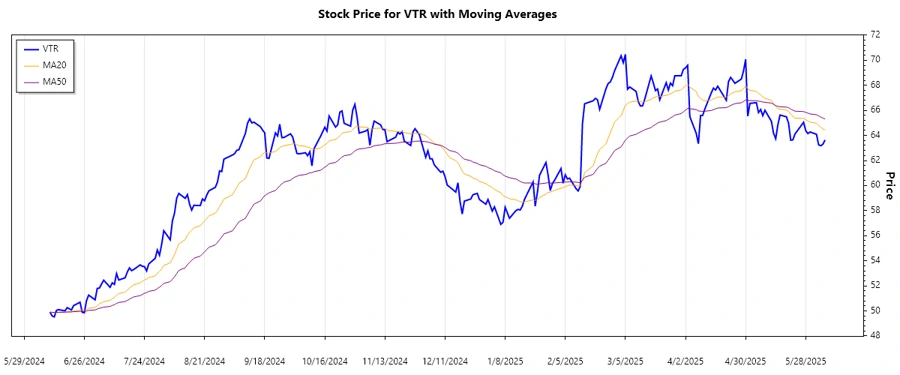
The trend analysis for Ventas, Inc. highlights a recent shift in market sentiment. After calculating the Exponential Moving Averages (EMAs), we observe that the EMA20 is currently below the EMA50, signaling a bearish phase.
| Date | Closing Price | Trend |
|---|---|---|
| 2025-06-06 | $63.64 | ▼ Downwards |
| 2025-06-05 | $63.30 | ▼ Downwards |
| 2025-06-04 | $63.18 | ▼ Downwards |
| 2025-06-03 | $63.25 | ▼ Downwards |
| 2025-06-02 | $64.09 | ▲ Upwards |
| 2025-05-30 | $64.28 | ▲ Upwards |
| 2025-05-29 | $64.15 | ▲ Upwards |
The closing prices have shown a recent tendency to fall, and technical indicators suggest maintaining caution until a confirmed reversal is observed.
Support- and Resistance
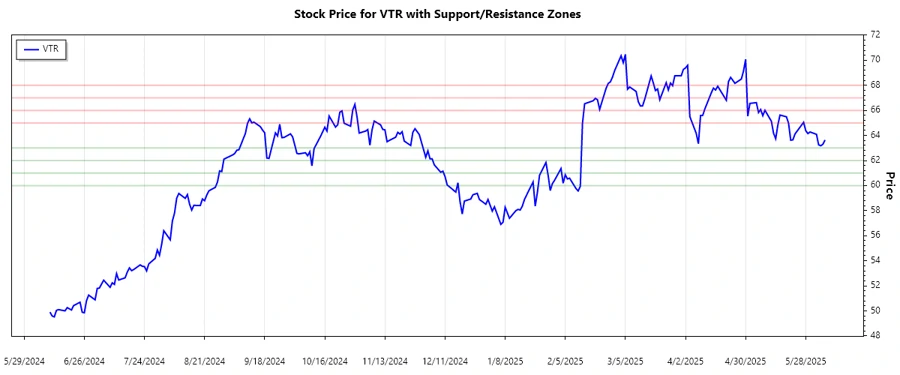
Upon examining the support and resistance levels, Ventas, Inc. is displaying significant zones that traders should be aware of.
| Zone Type | Zone From | Zone To |
|---|---|---|
| Support | ▼ $62.00 | ▼ $63.00 |
| Support | ▼ $60.00 | ▼ $61.00 |
| Resistance | ▲ $65.00 | ▲ $66.00 |
| Resistance | ▲ $67.00 | ▲ $68.00 |
The current price of $63.64 is positioned near the identified support zone, warranting close observation for potential bounces or breakdowns.
Conclusion
Ventas, Inc. faces a mix of opportunities and challenges in its present position. The aging population provides a supportive backdrop for growth, yet current technical signals point towards a cautious phase due to prevailing downward pressures. The company’s strategy of leveraging its real estate assets remains advantageous, but vigilance is recommended for investors as price movements near critical support levels.