December 09, 2025 a 07:31 am

VTR: Dividend Analysis - Ventas, Inc.
Ventas, Inc. offers a competitive dividend yield and a long history of dividend payments, reflecting its commitment to shareholders. Though recent growth is limited, its consistent track record provides a reliable investment. Analysis of its financial indicators suggests a challenging environment, yet Ventas maintains shareholder value through strategic management of its dividend policy.
📊 Overview
In a robust sector, Ventas, Inc. offers a historically stable dividend, appealing to income-focused investors. The company's commitment to sustaining dividends despite fluctuating market conditions demonstrates resilience.
| Sector | Dividend Yield | Current Dividend per Share | Dividend History | Last Cut or Suspension |
|---|---|---|---|---|
| Real Estate | 2.70% | $1.80 USD | 27 years | None |
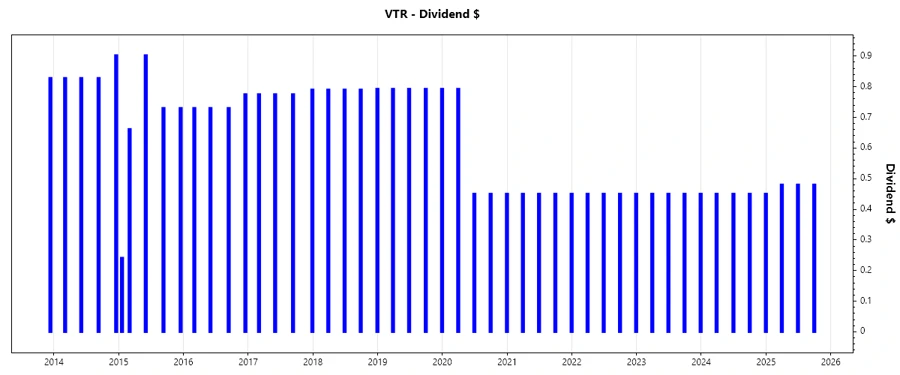
📈 Dividend History
With a dividend history stretching over 27 years, Ventas showcases remarkable commitment to rewarding its shareholders. The consistency in payments provides a sense of security and comfort for long-term investors.
| Year | Dividend per Share |
|---|---|
| 2025 | $1.44 |
| 2024 | $1.80 |
| 2023 | $1.80 |
| 2022 | $1.80 |
| 2021 | $1.80 |
📊 Dividend Growth
The dividend growth metrics for Ventas are modest, with a slight decline over the past 5 years. This indicates a period of adjustment or strategic reallocation of funds within the company.
| Time | Growth |
|---|---|
| 3 years | 0 % |
| 5 years | -0.11 % |
The average dividend growth is -0.11% over 5 years. This shows moderate but steady dividend growth.
📉 Payout Ratio
Payout ratios are a crucial indicator of a company's ability to maintain dividend payments. Ventas demonstrates a highly leveraged EPS payout ratio, which suggests challenges in sustainment without the support of operational cash flow.
| Key Figure | Ratio |
|---|---|
| EPS-based | 1422.16% |
| Free cash flow-based | 69.03% |
The extremely high EPS payout ratio conveys risk if earnings do not improve. The FCF payout ratio, however, appears more sustainable in the current environment.
💵 Cashflow & Capital Efficiency
Investors regard cash flow stability and capital efficiency as critical to assessing a company’s financial health. Ventas's positive cash flow yield supports operational liquidity, enhancing investor confidence in its management efficacy.
| Year | 2024 | 2023 | 2022 |
|---|---|---|---|
| Free Cash Flow Yield | 2.99% | 4.30% | 3.96% |
| Earnings Yield | 0.33% | -0.20% | -0.28% |
| CAPEX to Operating Cash Flow | 45.41% | 23.16% | 40.54% |
| Stock-based Compensation to Revenue | 0.63% | 0.69% | 0.74% |
| Free Cash Flow / Operating Cash Flow Ratio | 54.59% | 76.83% | 59.46% |
Overall, Ventas displays consistent capital efficiency, a necessity for maintaining its dividend and operational stability amidst market fluctuations.
🗣️ Balance Sheet & Leverage Analysis
An analysis of Ventas's balance sheet shows a robust debt structure necessary in navigating economic cycles. While leverage is slightly elevated, it remains within manageable limits given its asset base and liquidity ratios.
| Year | 2024 | 2023 | 2022 |
|---|---|---|---|
| Debt-to-Equity | 1.28 | 1.44 | 1.23 |
| Debt-to-Assets | 52.47% | 55.35% | 51.69% |
| Debt-to-Capital | 56.06% | 59.06% | 55.15% |
| Net Debt to EBITDA | 6.85 | 7.20 | 7.63 |
| Current Ratio | 1.03 | 0.73 | 0.61 |
| Quick Ratio | 1.03 | 0.73 | 0.61 |
| Financial Leverage | 2.43 | 2.61 | 2.38 |
While the debt levels and leverage ratios warrant monitoring, the current ratios suggest that the company can cover short-term obligations.
📚 Fundamental Strength & Profitability
Ventas's profitability ratios, despite being modest, indicate the potential for steady long-term gains. Its ability to generate returns above refinancing costs remains a growth lever.
| Year | 2024 | 2023 | 2022 |
|---|---|---|---|
| Return on Equity | 0.75% | -0.43% | -0.47% |
| Return on Assets | 0.31% | -0.17% | -0.20% |
| Margins: Net | 1.65% | -0.91% | -1.15% |
| Margins: EBIT | 14.34% | 14.79% | 9.92% |
| Margins: EBITDA | 38.04% | 40.71% | 39.24% |
| Margins: Gross | 42.59% | 17.14% | 44.71% |
| R&D to Revenue | 0.0% | 0.0% | 0.0% |
The consistency in EBITDA margins is encouraging, and management efficiency could eventually amplify profitability ratios in the long term.
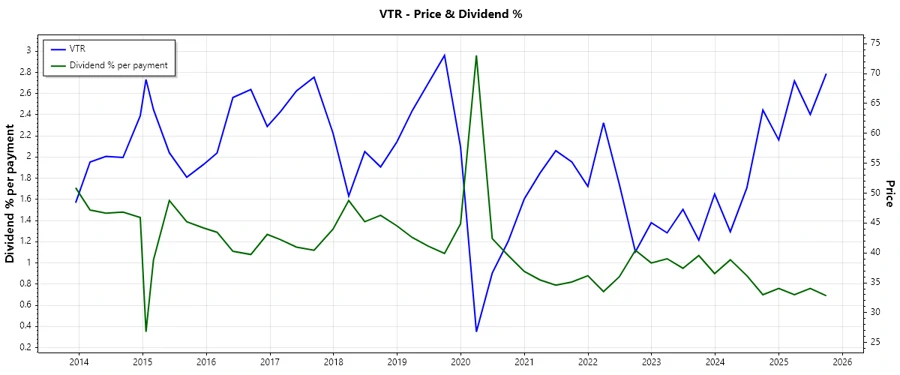
📊 Price Development
✅ Dividend Scoring System
| Category | Score | Score Bar |
|---|---|---|
| Dividend yield | 4 | |
| Dividend Stability | 4 | |
| Dividend growth | 2 | |
| Payout ratio | 2 | |
| Financial stability | 3 | |
| Dividend continuity | 5 | |
| Cashflow Coverage | 3 | |
| Balance Sheet Quality | 3 |
Total Score: 26/40
⚠️ Rating
Overall, while Ventas, Inc. demonstrates a strong history of dividend payments and a stable market presence, the high payout ratios and limited recent growth pose challenges. Caution is advised for investors seeking immediate dividend growth, while its long-term dividend stability may appeal to more conservative income investors.