November 22, 2025 a 12:46 pm


VTR: Dividend Analysis - Ventas, Inc.
Ventas, Inc. presents a mixed dividend profile with an enticing yield, but elevated payout ratios signal potential volatility. The company's resilience over 27 years of dividend history is commendable, yet recent declines in dividend growth and high EPS payout suggest caution. Stakeholders must weigh steady returns against the backdrop of financial vulnerabilities.
📊 Overview
Reviewing Ventas, Inc.'s dividend overview reveals a steady dividend yield, indicating a stable income source for investors. However, the high EPS payout ratio raises concerns about sustainability.
| Metric | Value |
|---|---|
| Sector | Real Estate |
| Dividend Yield | 2.7% |
| Current Dividend per Share | 1.80 USD |
| Dividend History | 27 years |
| Last Cut or Suspension | None |
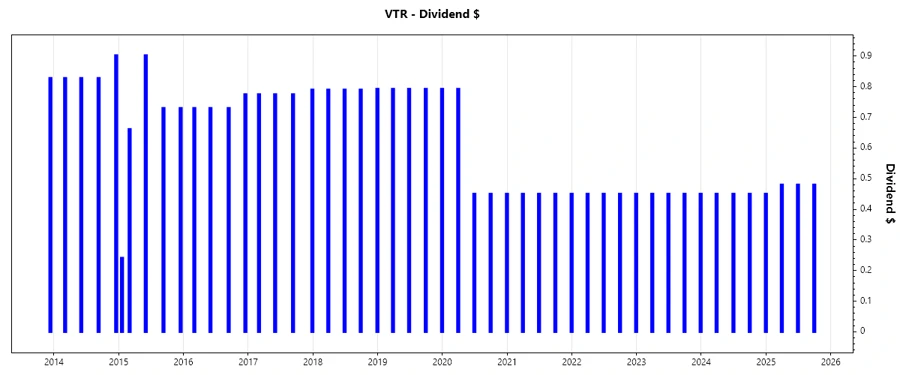
🗣️ Dividend History
The historical analysis showcases Ventas, Inc.'s commitment to consistent dividends. Steadfast distributions bolster investor confidence, yet recent cuts highlight the need for cautious optimism, reflecting broader economic or operational pressures.
| Year | Dividends per Share (USD) |
|---|---|
| 2025 | 1.44 |
| 2024 | 1.80 |
| 2023 | 1.80 |
| 2022 | 1.80 |
| 2021 | 1.80 |
📈 Dividend Growth
The company has experienced fluctuations in dividend growth, with negligible growth over the last three years and a negative trend over five years. This segment serves as an essential performance indicator and can reflect company profitability expectations.
| Time | Growth |
|---|---|
| 3 years | 0% |
| 5 years | -0.11% |
The average dividend growth is -0.11% over 5 years. This shows moderate but steady dividend growth, although recent data suggests a challenge in maintaining this trend.
📉 Payout Ratio
Payout ratios are critical indicators of financial health, presenting potential risks or stability in dividend maintenance. The EPS-based payout ratio of 1422.16% highlights sustainability concerns, whereas the FCF-based ratio of 69.03% suggests more controlled cash flow management.
| Key Figure | Ratio |
|---|---|
| EPS-based | 1422.16% |
| Free Cash Flow-based | 69.03% |
💼 Cashflow & Capital Efficiency
A robust evaluation of cash flow and capital metrics is essential for understanding the operational efficiency and financial agility of Ventas, Inc.
| Year | 2024 | 2023 | 2022 |
|---|---|---|---|
| Free Cash Flow Yield | 2.99% | 4.30% | 3.96% |
| Earnings Yield | 0.33% | -0.20% | -0.28% |
| CAPEX to Operating Cash Flow | 45.41% | 23.16% | 40.54% |
| Stock-based Compensation to Revenue | 0.63% | 0.69% | 0.74% |
| Free Cash Flow / Operating Cash Flow Ratio | 54.59% | 76.84% | 59.46% |
| Return on Invested Capital | 4.96% | 5.74% | 5.25% |
The presented data underscores substantial volatility in cash flow metrics, signifying both opportunities for capital efficiency improvement and potential challenges in sustaining operational yields.
⚠️ Balance Sheet & Leverage Analysis
A thorough analysis of leverage ratios and balance sheet strength is vital for assessing long-term financial health and risk management practices of Ventas, Inc.
| Year | 2024 | 2023 | 2022 |
|---|---|---|---|
| Debt-to-Equity | 1.28 | 1.44 | 1.23 |
| Debt-to-Assets | 0.52 | 0.55 | 0.52 |
| Debt-to-Capital | 0.56 | 0.59 | 0.55 |
| Net Debt to EBITDA | 6.70 | 7.19 | 7.63 |
| Current Ratio | 1.61 | 0.73 | 0.61 |
| Quick Ratio | 1.04 | 0.73 | 0.61 |
While Ventas, Inc. maintains reasonable levels of leverage, the increasing net debt to EBITDA ratio and varying current and quick ratios could pose liquidity challenges under economic duress.
✅ Fundamental Strength & Profitability
Examining profitability metrics reflects the operational efficiency and competitive position of Ventas, Inc. in the market.
| Year | 2024 | 2023 | 2022 |
|---|---|---|---|
| Return on Equity | -0.47% | -0.43% | -0.46% |
| Return on Assets | -0.20% | -0.16% | -0.20% |
| Net Margin | -1.15% | -0.91% | 1.65% |
The company's stability appears under threat, with negative returns affecting overall profitability. Strategic adjustments might be necessary to regain competitive edge.
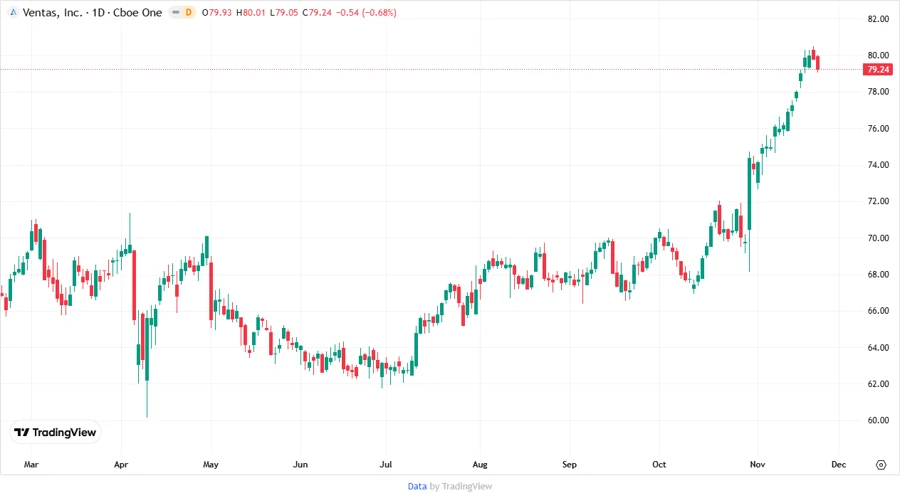
📈 Price Development
🏆 Dividend Scoring System
| Category | Score | |
|---|---|---|
| Dividend Yield | 4 | |
| Dividend Stability | 3 | |
| Dividend Growth | 2 | |
| Payout Ratio | 2 | |
| Financial Stability | 2 | |
| Dividend Continuity | 4 | |
| Cashflow Coverage | 3 | |
| Balance Sheet Quality | 3 |
Total Score: 23/40
🔍 Rating
Overall, Ventas, Inc. displays a stable yet cautious dividend profile. While consistent and moderately attractive in terms of yield, the pressure from high payout ratios and strategic challenges necessitates a conservative investment stance. Enhanced focus on profitability and operational efficiency could reassure investors of long-term viability.
Smart Data Insight
Master the Perfect Entry & Exit for this Stock
Don't leave your profits to chance. Historically, this stock follows specific seasonal patterns that institutional traders use to maximize returns.
- ✅ Identify the "Golden Buying Window"
- ✅ Avoid high-risk correction cycles
- ✅ Backtested data from the last 20+ years