October 13, 2025 a 11:31 am


📊 VTR: Dividend Analysis - Ventas, Inc.
Ventas, Inc. offers a moderate dividend profile with some complexities. Despite a historically stable dividend distribution, the company recently faced challenges resulting in zero growth over the last three years. A high payout ratio based on EPS raises concerns about sustainability, but its long history of 27 years without cuts provides reassurance. Investors should weigh the mixed signals of attractive yield against potential future adjustments in dividends.
Overview
🗣️ Ventas, Inc., operating in the real estate sector, presents a dividend yield of 2.70%. The current dividend per share stands at 1.80 USD, supported by a robust 27-year history. However, the absence of recent increases may reflect underlying profitability challenges or strategic financial management.
| Metric | Details |
|---|---|
| Sector | Real Estate |
| Dividend yield | 2.70% |
| Current dividend per share | 1.80 USD |
| Dividend history | 27 years |
| Last cut or suspension | None |
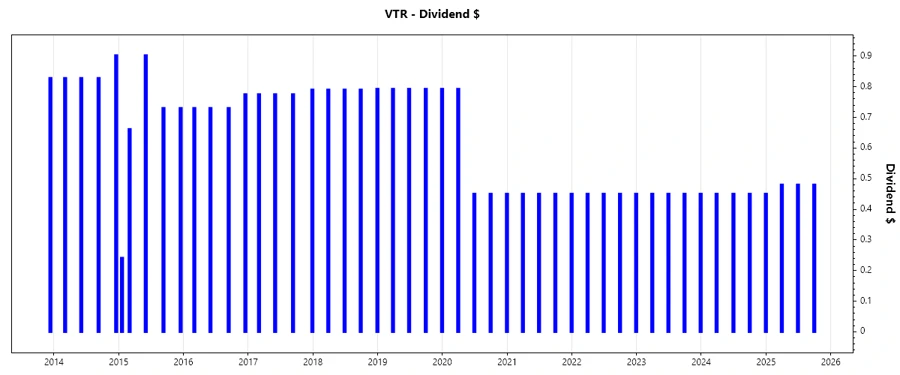
Dividend History
📈 The historical dividend trajectory shows persistence in maintaining payouts, underpinning investor confidence. Despite the lack of recent upward movement, Ventas has consistently distributed dividends over the years, reinforcing financial discipline.
| Year | Dividend per Share (USD) |
|---|---|
| 2025 | 1.44 |
| 2024 | 1.80 |
| 2023 | 1.80 |
| 2022 | 1.80 |
| 2021 | 1.80 |
Dividend Growth
📉 Growth metrics depict a slight contraction over 5 years, casting doubts about future increases. The lack of growth in the past three years signals potential cash flow pressures or strategic reinvestment of earnings.
| Time | Growth |
|---|---|
| 3 years | 0% |
| 5 years | -0.11% |
✅ The average dividend growth is -0.11% over 5 years. This shows moderate but steady dividend growth challenges requiring pragmatic financial management strategies.
Payout Ratio
🗣️ The payout ratios reveal critical insights into financial sustainability and dividend safety. Ventas, Inc.'s EPS-based payout ratio is significantly high at 419.66%, indicating potential overextension. Meanwhile, a more moderate FCF-based ratio of 76.17% suggests some resilience.
| Key figure | Ratio |
|---|---|
| EPS-based | 419.66% |
| Free cash flow-based | 76.17% |
⚠️ High EPS-based payout ratio indicates vulnerability if earnings continue to be suppressed, but adequate FCF backing may support near-term distributions.
Cashflow & Capital Efficiency
📊 Comprehensive cash flow assessment is vital to evaluate operating effectiveness and future payout potential. Steady free cash flow yield paired with careful management of capital expenditures underscores Ventas' focus on operational efficiency.
| Metric | 2024 | 2023 | 2022 |
|---|---|---|---|
| Free Cash Flow Yield | 2.99% | 4.30% | 3.96% |
| Earnings Yield | 0.33% | -0.20% | -0.28% |
| CAPEX to Operating Cash Flow | 45.41% | 23.16% | 40.54% |
| Stock-based Compensation to Revenue | 0.63% | 0.69% | 0.74% |
| Free Cash Flow / Operating Cash Flow Ratio | 54.59% | 76.84% | 59.46% |
✅ Stable cash flow generation capability allows for reliable capital reinvestment and shareholder returns despite bottom-line volatility.
Balance Sheet & Leverage Analysis
📈 Analyzing leverage provides insights into Ventas' financial health and debt sustainability. Current metrics indicate moderate leverage with substantial debt-to-equity ratios, requiring careful monitoring amidst interest rate fluctuations.
| Ratio | 2024 | 2023 | 2022 |
|---|---|---|---|
| Debt-to-Equity | 1.28 | 1.44 | 1.23 |
| Debt-to-Assets | 0.52 | 0.55 | 0.52 |
| Debt-to-Capital | 0.56 | 0.59 | 0.55 |
| Net Debt to EBITDA | 6.86 | 7.20 | 7.63 |
| Current Ratio | 1.04 | 0.73 | 0.61 |
| Quick Ratio | 1.04 | 0.73 | 0.61 |
| Financial Leverage | 2.43 | 2.61 | 2.38 |
⚠️ While leverage ratios are manageable, ongoing attention to debt servicing capacity remains imperative for maintaining financial stability.
Fundamental Strength & Profitability
📉 Profitability insights enable a thorough understanding of Ventas' operational efficiency. Challenging return metrics align with sector trends, highlighting reliance on cost containment for profitability enhancement.
| Metric | 2024 | 2023 | 2022 |
|---|---|---|---|
| Return on Equity | 0.75% | -0.43% | -0.47% |
| Return on Assets | 0.31% | -0.17% | -0.20% |
| Gross Margin | 42.59% | 17.14% | 44.71% |
| EBIT Margin | 13.27% | 14.79% | 9.92% |
| EBITDA Margin | 38.04% | 40.71% | 39.24% |
| Net Margin | 1.65% | -0.91% | -1.15% |
| R&D to Revenue | 0% | 0% | 0% |
⚠️ Sector-aligned metrics demonstrate a need for enhanced strategies focused on profitability, particularly as pressures mount across real estate operations.
Price Development
Dividend Scoring System
| Criteria | Score | Rating |
|---|---|---|
| Dividend yield | 3 | |
| Dividend Stability | 4 | |
| Dividend growth | 2 | |
| Payout ratio | 2 | |
| Financial stability | 3 | |
| Dividend continuity | 4 | |
| Cashflow Coverage | 3 | |
| Balance Sheet Quality | 3 |
Overall Score: 24/40
Rating
✅ Ventas, Inc. retains a "Hold" recommendation with a balanced precaution. Its dividend history and reasonable yield underscore its appeal. However, high payout ratios alongside slow growth demand cautious optimism, suggesting vigilant monitoring of fiscal health and strategic operational shifts.
Smart Data Insight
Master the Perfect Entry & Exit for this Stock
Don't leave your profits to chance. Historically, this stock follows specific seasonal patterns that institutional traders use to maximize returns.
- ✅ Identify the "Golden Buying Window"
- ✅ Avoid high-risk correction cycles
- ✅ Backtested data from the last 20+ years