June 20, 2025 a 03:31 am


VTR: Dividend Analysis - Ventas, Inc.
Ventas, Inc. is a notable player in the Real Estate sector, known for its significant dividend history and robust market capitalization. Despite facing challenges in recent years, its commitment to returning value to shareholders remains steadfast. Through insightful analysis of its dividend yield and payout ratios, investors can gain a clearer understanding of its financial health and potential as a dividend-returning entity.
Overview 📊
Detailed analysis of the sector, dividend yield, and dividend history provide insight into the stability and potential of Ventas, Inc. as a dividend-paying stock.
| Metric | Value |
|---|---|
| Sector | Real Estate |
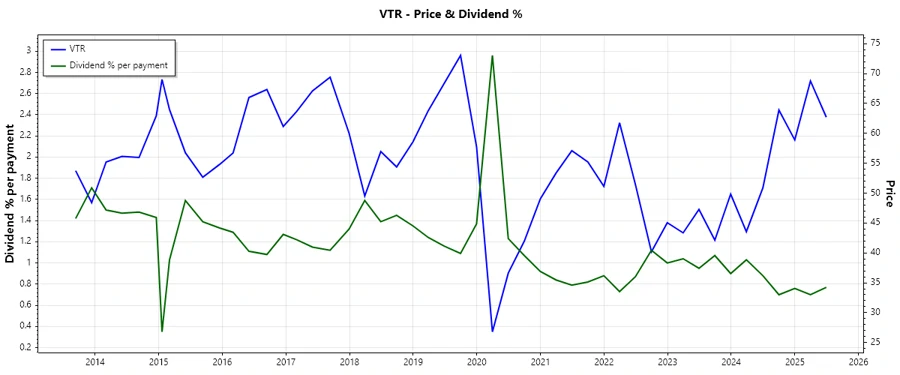
| Dividend yield | 2.97 % |
| Current dividend per share | $1.80 USD |
| Dividend history years | 27 |
| Last cut or suspension | None |
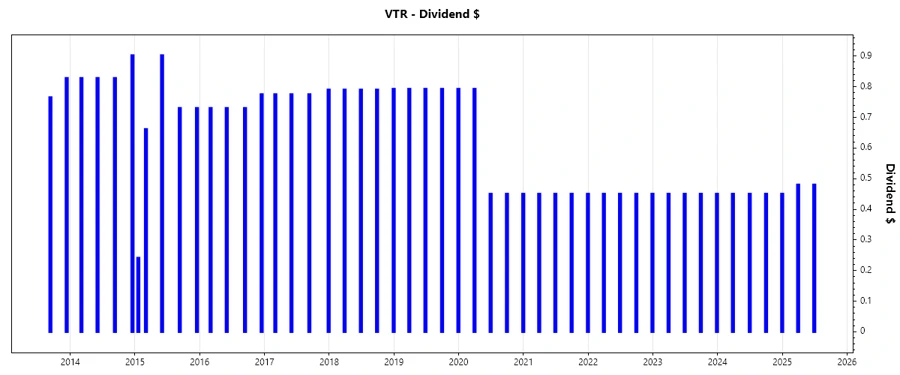
Dividend History 🗣️
Examining the dividend history is crucial for evaluating the consistency and reliability of dividend payments, which are key indicators of financial stability and shareholder value.
| Year | Dividend per share (USD) |
|---|---|
| 2025 | $0.96 |
| 2024 | $1.80 |
| 2023 | $1.80 |
| 2022 | $1.80 |
| 2021 | $1.80 |
Dividend Growth 📈
The growth of dividends is an essential metric for gauging long-term financial health and the company's ability to increase shareholder value.
| Time | Growth |
|---|---|
| 3 years | 0 % |
| 5 years | -0.11 % |
The average dividend growth is -0.11 % over 5 years. This shows moderate but steady dividend growth.
Payout Ratio ⚠️
Understanding payout ratios helps determine if the company can sustain its dividends amidst its earnings and cash flow capabilities.
| Key figure | Ratio |
|---|---|
| EPS-based | 555.71 % |
| Free cash flow-based | 92.48 % |
Both the EPS-based and FCF-based payout ratios suggest caution. The extremely high EPS payout reflects a delicate balance in earnings relative to dividends, indicating potential sustainability concerns.
Cashflow & Capital Efficiency ✅
Cash flow and capital efficiency metrics offer insights into the operational health and investment returns of the company.
| Metric | 2024 | 2023 | 2022 |
|---|---|---|---|
| Free Cash Flow Yield | 2.99 % | 4.67 % | 3.96 % |
| Earnings Yield | 0.33 % | -0.20 % | -0.24 % |
| CAPEX to Operating Cash Flow | 45.41 % | 23.16 % | 40.54 % |
| Stock-based Compensation to Revenue | 0.63 % | 0.72 % | 0.74 % |
| Free Cash Flow / Operating Cash Flow Ratio | 54.59 % | 83.50 % | 59.46 % |
The data suggests a mixed efficacy in cash flow management and capital efficiency, limited by the declining earnings yield but supplemented by a reasonable free cash flow yield.
Balance Sheet & Leverage Analysis 📉
Assessing balance sheet strength and leverage ratios is imperative for understanding the company’s financial stability and risk exposure.
| Metric | 2024 | 2023 | 2022 |
|---|---|---|---|
| Debt-to-Equity | 127.57 % | 144.24 % | 127.21 % |
| Debt-to-Assets | 52.47 % | 55.35 % | 53.46 % |
| Debt-to-Capital | 56.06 % | 59.06 % | 55.99 % |
| Net Debt to EBITDA | 6.86 | 7.20 | 7.74 |
| Current Ratio | 1.03 | 0.78 | 0.66 |
| Quick Ratio | 1.04 | 0.78 | 0.26 |
| Financial Leverage | 2.43 | 2.61 | 2.38 |
This data indicates significant leverage, with higher debt-to-equity levels signaling potential risk, though mitigated by relatively stable financial leverage ratios.
Fundamental Strength & Profitability 📈
Key fundamental and profitability metrics shed light on efficiency, resource allocation, and overall business performance.
| Metric | 2024 | 2023 | 2022 |
|---|---|---|---|
| Return on Equity | 0.75 % | -0.43 % | -0.40 % |
| Return on Assets | 0.31 % | -0.17 % | -0.17 % |
| Margins: Net | 1.65 % | -0.91 % | -0.99 % |
| EBIT Margin | 13.27 % | 14.79 % | 9.92 % |
| EBITDA Margin | 38.04 % | 40.71 % | 40.00 % |
| Gross Margin | 42.59 % | 17.14 % | 44.71 % |
| R&D to Revenue | 0.00 % | 0.00 % | 0.00 % |
Despite volatile returns, consistent EBITDA margins and disciplined cost management reflect operational resilience in challenging conditions.
Price Development 📈
Dividend Scoring System 🏆
| Category | Score | |
|---|---|---|
| Dividend Yield | 3 | |
| Dividend Stability | 4 | |
| Dividend Growth | 2 | |
| Payout Ratio | 2 | |
| Financial Stability | 3 | |
| Dividend Continuity | 5 | |
| Cashflow Coverage | 3 | |
| Balance Sheet Quality | 3 |
Total Score: 25/40
Rating 🌟
Ventas, Inc. offers a stable dividend yield and demonstrates consistent dividend continuity. However, the elevated payout ratios and mixed leverage indicators highlight the importance of continued financial diligence. Investors should weigh these factors against their investment strategy, assessing both potential risk and steady income opportunities.
Smart Data Insight
Master the Perfect Entry & Exit for this Stock
Don't leave your profits to chance. Historically, this stock follows specific seasonal patterns that institutional traders use to maximize returns.
- ✅ Identify the "Golden Buying Window"
- ✅ Avoid high-risk correction cycles
- ✅ Backtested data from the last 20+ years