August 26, 2025 a 09:04 am

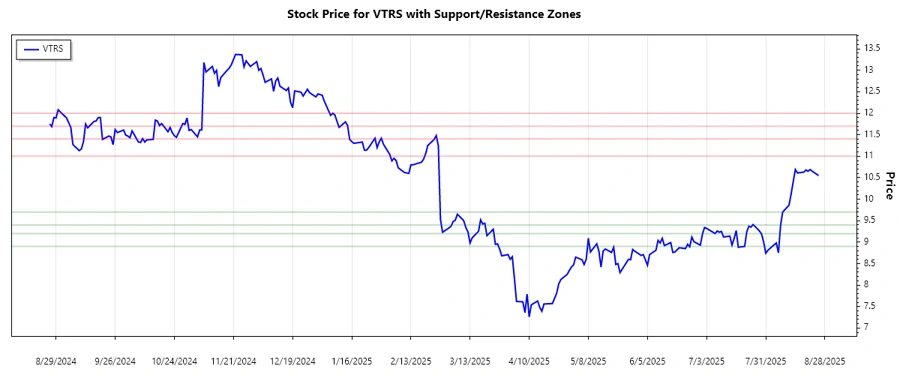
VTRS: Trend and Support & Resistance Analysis - Viatris Inc.
The recent performance of Viatris Inc. shows noticeable fluctuations, yet with an underlying upward momentum. The stock exhibited stability in the short term, which might suggest potential support from the market. However, external factors such as changes in healthcare regulation could impact the stock's future trend. Investors should keep an eye on emerging markets as they increasingly contribute to the company’s revenue.
Trend Analysis
| Date | Close Price | Trend |
|---|---|---|
| 2025-08-25 | 10.55 | ⚖️ |
| 2025-08-22 | 10.65 | ▲ |
| 2025-08-21 | 10.69 | ▲ |
| 2025-08-20 | 10.65 | ⚖️ |
| 2025-08-19 | 10.68 | ▲ |
| 2025-08-18 | 10.63 | ⚖️ |
| 2025-08-15 | 10.61 | ⚖️ |
The EMA20 is consistently above the EMA50, confirming a bullish trend with slight corrections indicating minor consolidation phases. This suggests potential short-term buying opportunities, especially if the recent price levels hold above key support zones.
Support and Resistance
| Zone Type | From | To | Zone Status |
|---|---|---|---|
| Support | 8.9 | 9.2 | 🔽 |
| Support | 9.4 | 9.7 | 🔼 |
| Resistance | 11.0 | 11.4 | 🔼 |
| Resistance | 11.7 | 12.0 | 🔼 |
Currently, the stock price resides within the lower resistance zone (11.0 - 11.4), indicating reluctance to break through this ceiling. However, sustained volume and positive market forces could apply the necessary pressure to penetrate these levels.
Conclusion
Viatris Inc.'s stock is poised within crucial resistance zones, which suggests potential further upward movement upon successful breach. The stock’s trend indicates a bullish bias; however, investors should remain cautious of macroeconomic factors that might induce volatility. The established support zones offer a cushion against abrupt price dips. As the stock navigates towards new ground, it presents both attractive opportunities for growth and inherent risks due to its current resistance testing.