April 15, 2026 a 03:15 pm
VTRS: Fibonacci Analysis - Viatris Inc.
Viatris Inc. (ticker: VTRS) has recently shown a significant downturn, aligning with broader market trends in the healthcare sector. This decline may present opportunities for long-term investors seeking to capitalize on lower entry prices. However, potential investors should be cautious and look for signs of stabilization before jumping in.
Fibonacci Analysis
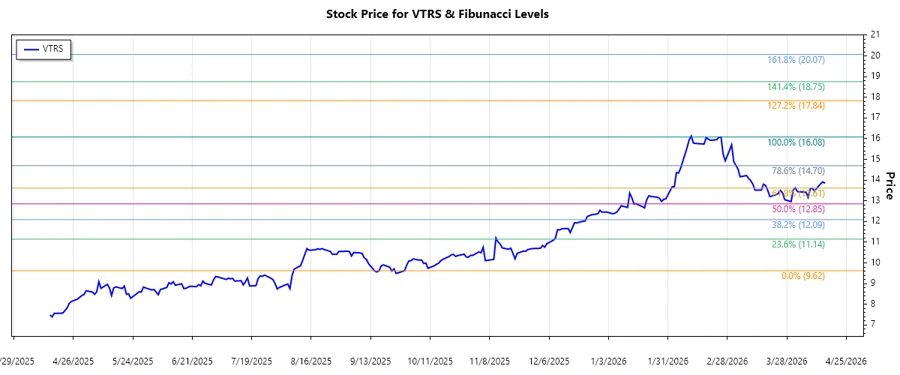
The dominant trend for Viatris Inc. was an upward movement, beginning in October 2025 and peaking in February 2026. This analysis calculates the Fibonacci retracement levels to identify critical support and resistance areas.
| Trend Start Date | Trend End Date | High Price | Low Price |
|---|---|---|---|
| 2025-10-09 | 2026-02-25 | $16.08 (2026-02-25) | $9.62 (2025-09-29) |
| Fibonacci Level | Price |
|---|---|
| 23.6% | $13.75 |
| 38.2% | $12.82 |
| 50.0% | $12.35 |
| 61.8% | $11.88 |
| 78.6% | $11.31 |
As of now, the current price is at $13.845 (2026-04-15), which is above the 23.6% retracement level, indicating potential support at this level if the price declines further.
The price being in the retracement area suggests a consolidation phase, and a break above could lead to further upward momentum. However, if it fails to hold, the stock may test further levels down, acting as support, depending on broader market conditions.
Conclusion
Viatris Inc. (VTRS) presents both risks and opportunities for investors. The current price position suggests a potential support area if the market sentiment holds. Nevertheless, the broader economic factors and sector performances will heavily influence its direction. An investor should consider these levels as potential entries or exits but remain aware of the macroeconomic climate, which could change the dynamics swiftly. The Fibonacci levels provide insight into possible future price movements and assist in managing risk effectively.