November 06, 2025 a 03:15 pm
VTRS: Fibonacci Analysis - Viatris Inc.
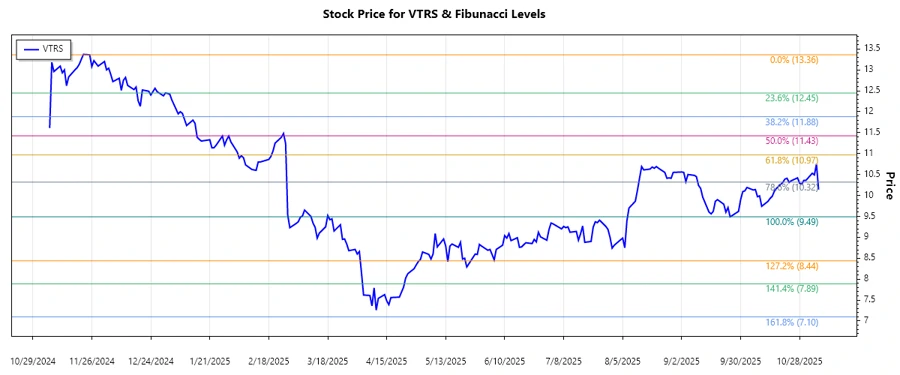
Viatris Inc., operating within a broad healthcare spectrum, has demonstrated a significant downtrend over the past months. The stock, which once enjoyed higher prices, has faced pressures leading to a recent low. Technical analysis through Fibonacci levels can offer insights into potential recovery points or further declines.
Fibonacci Analysis
| Detail | Information |
|---|---|
| Trend Type | Downtrend |
| Start Date | 2024-12-26 |
| End Date | 2025-11-06 |
| High Price (Date) | 13.36 (2024-11-25) |
| Low Price (Date) | 9.49 (2025-09-25) |
| Fibonacci Level | Price |
|---|---|
| 0.236 | 10.48 |
| 0.382 | 10.91 |
| 0.5 | 11.42 |
| 0.618 | 11.93 |
| 0.786 | 12.56 |
The current trading price is at $10.14, which is near the 0.236 Fibonacci retracement level. This indicates a point where investors might expect some resistance or a potential reversal, hinting at a mild support zone.
Conclusion
Viatris Inc.'s stock is currently in a corrective phase following a substantial drop from its previous high. Monitoring the resistance at the 0.236 Fibonacci level is crucial as it may indicate potential reversal signals or further downturns. The ability of the stock to maintain or rebound at this level can be a vital determinant for upcoming trends. However, remaining below this zone could signal more selling pressure ahead. Analysts must consider both the fundamental backdrop of Viatris and external economic factors impacting the broader healthcare market.
Smart Data Insight
Master the Perfect Entry & Exit for this Stock
Don't leave your profits to chance. Historically, this stock follows specific seasonal patterns that institutional traders use to maximize returns.
- ✅ Identify the "Golden Buying Window"
- ✅ Avoid high-risk correction cycles
- ✅ Backtested data from the last 20+ years