October 19, 2025 a 11:44 am

VTRS: Fibonacci Analysis - Viatris Inc.
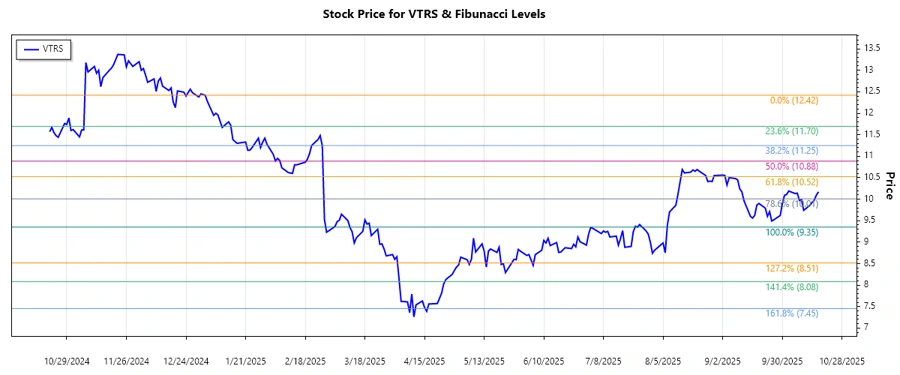
Viatris Inc. has demonstrated a volatile market pattern with significant price fluctuations over recent months. The stock's recent performance depicts a downward trend, which aligns with broader market tendencies amidst economic uncertainties. Despite challenges, Viatris's presence in diverse pharmaceutical sectors provides a resilience buffer against market volatility.
Fibonacci Analysis
Analyzing the recent downtrend in Viatris Inc. stock, we conduct a Fibonacci retracement analysis to determine key levels of support and resistance for traders and investors.
| Start Date | End Date | High Price | Low Price | Fibonacci Levels |
|---|---|---|---|---|
| 2025-01-02 | 2025-10-17 | $12.42 (2025-01-02) | $9.35 (2025-09-25) |
|
The current stock price, $10.17, is within the 0.236 retracement level, indicating potential minor support around this area. Should the price hold above this level, it could act as a springboard for an upward correction. Conversely, falling below might imply a continuation of the downtrend.
Conclusion
Viatris Inc.'s stock is currently in a retracement phase following a stark downtrend from its peak in January 2025. With the price hovering around the 0.236 Fibonacci level, investors should remain cautious. The downtrend reflects broader uncertainties in the healthcare sector. However, Viatris's diversified portfolio could provide strategic value over the medium to long term. Analysts should closely monitor market conditions and identify any potential buy opportunities as the price approaches significant support levels. Overall, patience and strategic entry points appear essential in this current market scenario.
Smart Data Insight
Master the Perfect Entry & Exit for this Stock
Don't leave your profits to chance. Historically, this stock follows specific seasonal patterns that institutional traders use to maximize returns.
- ✅ Identify the "Golden Buying Window"
- ✅ Avoid high-risk correction cycles
- ✅ Backtested data from the last 20+ years