May 02, 2026 a 07:31 am

VTRS: Dividend Analysis - Viatris Inc.
Viatris Inc. has a long history of maintaining its dividend payout over the years. The company's current dividend yield positions it as a moderately attractive choice for income-oriented investors, though the payout ratios and recent lack of dividend growth require careful consideration. With its diversified portfolio, Viatris holds the potential for stability in dividend payouts.
📊 Overview
Viatris operates in the Healthcare sector, featuring a dividend yield of 3.38%, accompanied by a current dividend per share of 0.48 USD. The company has established a consistent history of 28 years of dividend payments without any recorded cuts or suspensions.
| Metric | Value |
|---|---|
| Sector | Healthcare |
| Dividend yield | 3.38 % |
| Current dividend per share | 0.48 USD |
| Dividend history | 28 years |
| Last cut or suspension | None |
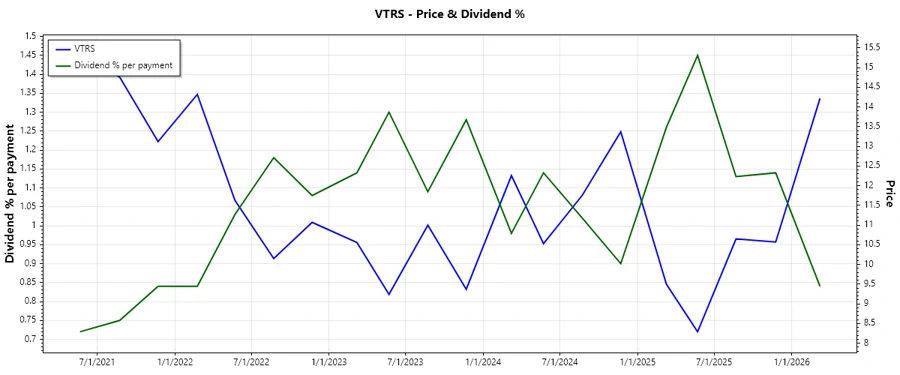
📈 Dividend History
Understanding dividend history is crucial in assessing the reliability of a company's dividend payments over time. Viatris has demonstrated consistent dividend distribution, which is integral for long-term income planning.
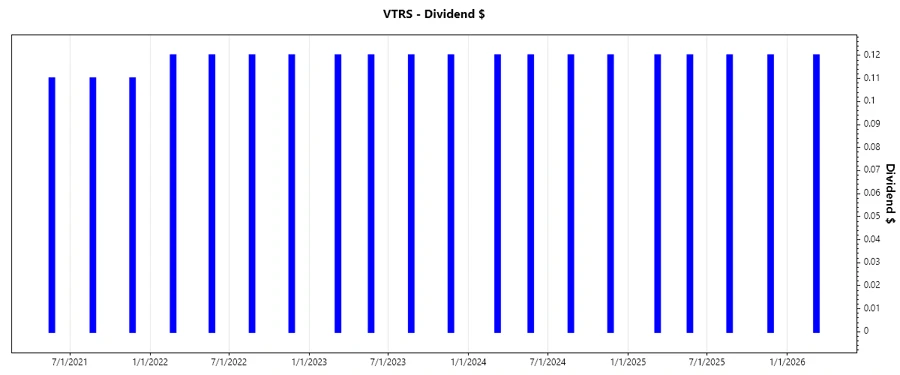
| Year | Dividend per Share (USD) |
|---|---|
| 2026 | 0.12 |
| 2025 | 0.48 |
| 2024 | 0.48 |
| 2023 | 0.48 |
| 2022 | 0.48 |
🗣️ Dividend Growth
The growth of dividends over time indicates a company's ability to enhance shareholder returns. Although Viatris' dividend growth remains modest over five years at 0.32%, it reflects a steady capacity to maintain distributions.
| Time | Growth |
|---|---|
| 3 years | 0 % |
| 5 years | 0.32 % |
The average dividend growth is 0.32% over 5 years. This shows moderate but steady dividend growth.
📝 Payout Ratio
Payout ratios provide insight into the sustainability of a company's dividend. Viatris presents a negative EPS-based payout ratio of -15.72% due to negative earnings but maintains a more promising free cash flow-based ratio of 30.66%.
| Key figure | Ratio |
|---|---|
| EPS-based | -15.72 % |
| Free cash flow-based | 30.66 % |
The EPS payout ratio indicates potential difficulty, but the FCF ratio suggests a healthier coverage of dividends from cash flows.
💡 Cashflow & Capital Efficiency
An analysis of cash flow metrics is vital in judging a company's operational efficiency and its investment capacity. Viatris maintains a respectable free cash flow yield of 10.39%.
| Metric | 2025 | 2024 | 2023 |
|---|---|---|---|
| Free Cash Flow Yield | 13.29 % | 13.31 % | 17.89 % |
| Earnings Yield | -24.12 % | -4.27 % | 0.42 % |
| CAPEX to Operating Cash Flow | 21.40 % | 14.16 % | 16.95 % |
| Stock-based Compensation to Revenue | 0.12 % | 0.10 % | 0.12 % |
| Free Cash Flow / Operating Cash Flow Ratio | 83.64 % | 85.84 % | 83.05 % |
Maintaining a robust free cash flow yield alongside capital efficiency measures reflects the company's potential to sustain investments and dividend covers amidst fluctuations.
🔍 Balance Sheet & Leverage Analysis
Debt metrics measure the risk and financial flexibility of a company. Viatris has a balanced debt to equity ratio and maintains a moderate liquidity profile as seen in current and quick ratios.
| Metric | 2025 | 2024 | 2023 |
|---|---|---|---|
| Debt-to-Equity | 1.00 | 0.77 | 0.90 |
| Debt-to-Assets | 39.53% | 34.47% | 38.53% |
| Debt-to-Capital | 49.98% | 43.43% | 47.30% |
| Net Debt to EBITDA | -33.77 | 4.81 | 4.94 |
| Current Ratio | 1.30 | 1.65 | 1.67 |
| Quick Ratio | 0.74 | 0.98 | 1.22 |
| Financial Leverage | 2.53 | 2.23 | 2.33 |
The financial stability of Viatris is stable with a continuous evaluation necessary to mitigate risks from moderate leverage factors.
🔎 Fundamental Strength & Profitability
Profitability ratios are essential indicators of a company's core financial performance. Viatris has exhibited negative net and EBIT margins, which necessitates improvement for sustainable growth.
| Metric | 2025 | 2024 | 2023 |
|---|---|---|---|
| Return on Equity | -23.89% | -3.40% | 0.27% |
| Return on Assets | -9.45% | -1.53% | 0.11% |
| Net Margin | -24.58% | -4.30% | 0.35% |
| EBIT Margin | -22.33% | -0.50% | 5.03% |
| EBITDA Margin | -2.77% | 19.13% | 22.79% |
| Gross Margin | 35.06% | 38.15% | 41.74% |
| R&D to Revenue | 6.75% | 5.49% | 5.22% |
The necessary focus remains on enhancing profitability ratios and operational metrics to elevate Viatris' foundational strength within the sector.
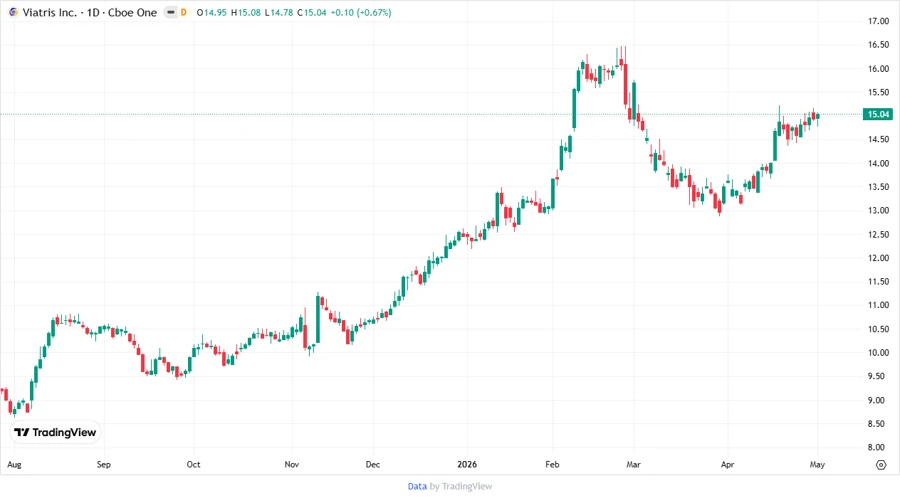
🚀 Price Development
📊 Dividend Scoring System
| Criteria | Score | |
|---|---|---|
| Dividend yield | 4 | |
| Dividend Stability | 5 | |
| Dividend growth | 1 | |
| Payout ratio | 2 | |
| Financial stability | 3 | |
| Dividend continuity | 5 | |
| Cashflow Coverage | 3 | |
| Balance Sheet Quality | 3 |
Total Score: 26/40
✅ Rating
Viatris Inc. presents a reliable history of dividend payments with a competitive yield. However, the negative payout ratios and need for stronger profitability metrics suggest cautious optimism is warranted. Investors seeking stable income may find Viatris attractive, if complemented by a comprehensive risk assessment strategy.
Smart Data Insight
Master the Perfect Entry & Exit for this Stock
Don't leave your profits to chance. Historically, this stock follows specific seasonal patterns that institutional traders use to maximize returns.
- ✅ Identify the "Golden Buying Window"
- ✅ Avoid high-risk correction cycles
- ✅ Backtested data from the last 20+ years