September 17, 2025 a 02:47 am
VTRS: Dividend Analysis - Viatris Inc.
Viatris Inc., with a substantial market cap of $11.15 billion, presents a dividend yield of 4.51%, signifying income potential for investors. Despite recent negative EPS and earnings figures, the company has maintained a consistent dividend payout history totaling 27 years. This showcases resilience in its dividend policy, though attention to evolving financial metrics is crucial for a comprehensive investment decision.
Overview 📊
The following overview provides insight into Viatris Inc.'s dividend profile within the pharmaceuticals sector. The company's dividend yield stands at 4.51%, accompanied by a current dividend per share of $0.48. Viatris has sustained a remarkable 27 years of dividend history, demonstrating its commitment to returning capital to shareholders. Notably, there have been no recent cuts or suspensions.
| Key Metric | Value |
|---|---|
| Sector | Pharmaceuticals |
| Dividend Yield | 4.51% |
| Current Dividend per Share | $0.48 |
| Dividend History | 27 years |
| Last Cut or Suspension | None |
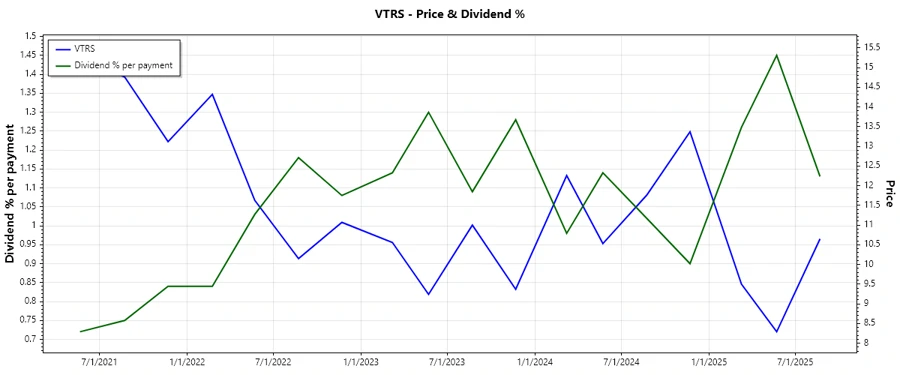
Dividend History 📉
Evaluating the dividend history is crucial when assessing the reliability and potential risks associated with receiving future dividends. Viatris has maintained a steady pattern of payments, reflecting consistent returns for investors over the years.
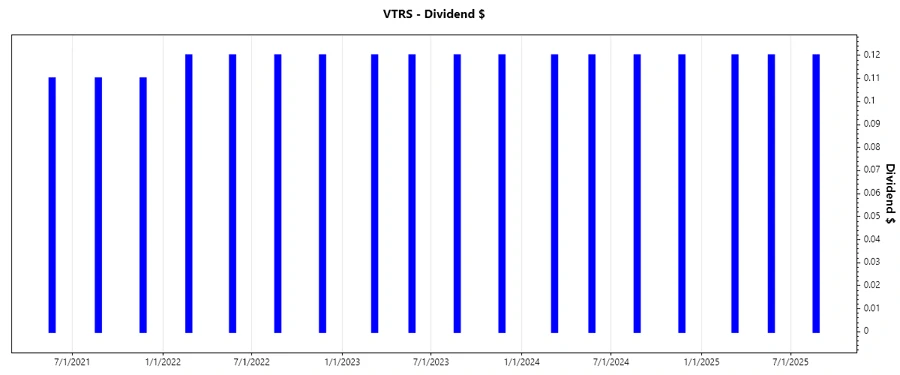
| Year | Dividend per Share (USD) |
|---|---|
| 2025 | 0.36 |
| 2024 | 0.48 |
| 2023 | 0.48 |
| 2022 | 0.48 |
| 2021 | 0.33 |
Dividend Growth 📈
Analyzing dividend growth offers insights into the company's financial health and its ability to increase shareholder returns over time. Viatris exhibits a moderate yet notable dividend growth rate.
| Time | Growth |
|---|---|
| 3 years | 13.30% |
| 5 years | 31.95% |
The average dividend growth is 31.95% over 5 years. This shows moderate but steady dividend growth, indicating a potential for sustained increases in investor payouts.
Payout Ratio ✅
The payout ratio is essential to determine how much profit is returned to shareholders as dividends. A mixed picture emerges from Viatris' payout ratios.
| Key Figure | Ratio |
|---|---|
| EPS-based | -16.29% |
| Free Cash Flow-based | 30.21% |
The negative EPS-based payout ratio indicates current earnings inadequacies, yet a sustainable Free Cash Flow-based payout ratio of 30.21% demonstrates financial viability in dividend payments.
Cashflow & Capital Efficiency ⚠️
Understanding cash flow dynamics and capital efficiency metrics provides insight into a company's operational health and investment capabilities.
| Metric | 2024 | 2023 | 2022 |
|---|---|---|---|
| Free Cash Flow Yield | 13.31% | 17.89% | 18.60% |
| Earnings Yield | -4.27% | 0.42% | 15.41% |
| CAPEX to Operating Cash Flow | 14.16% | 16.95% | 15.00% |
| Stock-based Compensation to Revenue | 0.99% | 1.17% | 0.71% |
| Free Cash Flow / Operating Cash Flow Ratio | 85.84% | 83.05% | 84.99% |
The metrics indicate adequate free cash flow yield and prudent capital expenditure management, suggesting efficient capital usage and cash stability.
Balance Sheet & Leverage Analysis 🗣️
A solid balance sheet and manageable leverage are crucial for long-term sustainability and risk mitigation.
| Metric | 2024 | 2023 | 2022 |
|---|---|---|---|
| Debt-to-Equity | 0.77 | 0.90 | 0.91 |
| Debt-to-Assets | 0.34 | 0.39 | 0.39 |
| Debt-to-Capital | 0.43 | 0.47 | 0.48 |
| Net Debt to EBITDA | 4.81 | 5.03 | 2.80 |
| Current Ratio | 1.65 | 1.67 | 1.58 |
| Quick Ratio | 0.98 | 1.22 | 1.05 |
| Financial Leverage | 2.23 | 2.33 | 2.37 |
The analysis reveals moderate leverage with viable liquidity metrics, promoting stability yet necessitating careful debt management.
Fundamental Strength & Profitability 💡
Evaluating profitability and fundamental strength is essential for assessing a company's economic value generation capabilities.
| Metric | 2024 | 2023 | 2022 |
|---|---|---|---|
| Return on Equity | -3.40% | 0.27% | 9.86% |
| Return on Assets | -1.53% | 0.11% | 4.16% |
| Net Margin | -4.30% | 0.35% | 12.78% |
| EBIT Margin | -0.50% | 5.03% | 20.94% |
| EBITDA Margin | 19.13% | 22.41% | 39.56% |
| Gross Margin | 38.15% | 41.74% | 39.95% |
| R&D to Revenue | 5.49% | 5.90% | 4.07% |
Despite challenges, positive gross and EBITDA margins showcase operational efficiency, though improvements in net profitability are imperative.
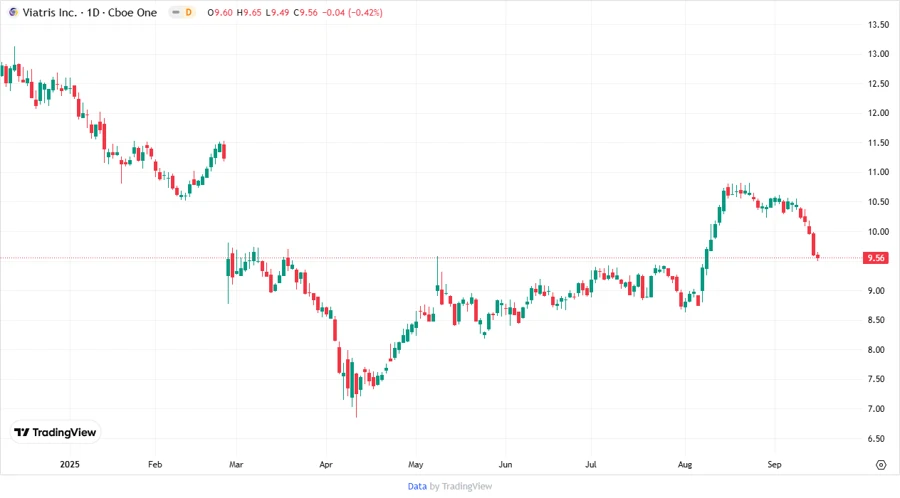
Price Development 📈
Dividend Scoring System 💯
| Criterion | Rating (1-5) | Score |
|---|---|---|
| Dividend Yield | 4 | |
| Dividend Stability | 3 | |
| Dividend Growth | 4 | |
| Payout Ratio | 2 | |
| Financial Stability | 3 | |
| Dividend Continuity | 4 | |
| Cashflow Coverage | 3 | |
| Balance Sheet Quality | 3 |
Total Score: 26/40
Rating 🏆
Viatris Inc. is a stable dividend-paying entity with moderate growth prospects. Investors should weigh the positive yield and lengthy dividend history against uncertainties in some profitability metrics. The overall score reflects a balanced opportunity with a need for vigilance regarding financial results and market conditions.
Smart Data Insight
Master the Perfect Entry & Exit for this Stock
Don't leave your profits to chance. Historically, this stock follows specific seasonal patterns that institutional traders use to maximize returns.
- ✅ Identify the "Golden Buying Window"
- ✅ Avoid high-risk correction cycles
- ✅ Backtested data from the last 20+ years