August 22, 2025 a 02:47 am


VTRS: Dividend Analysis - Viatris Inc.
Viatris Inc. showcases a robust dividend profile, promising stable returns for income-focused investors. With over 27 years of uninterrupted dividend payments, it stands as a testament to financial resilience. Although recent financial figures reflect some stress, the company's commitment to returning value to its shareholders remains evident. This analysis will delve into Viatris' dividend aspects, scrutinizing its growth trends, payout ratios, and underlying financial metrics.
📊 Overview
Viatris operates within the health sector, offering a substantial dividend yield of 4.49%. Its current dividend per share is noted at $0.48, sustained over 27 consecutive years of payment history, with no recent cuts or suspensions. This stability is particularly valuable for investors seeking reliable income streams.
| Metric | Details |
|---|---|
| Sector | Health |
| Dividend yield | 4.49% |
| Current dividend per share | $0.48 USD |
| Dividend history | 27 years |
| Last cut or suspension | None |
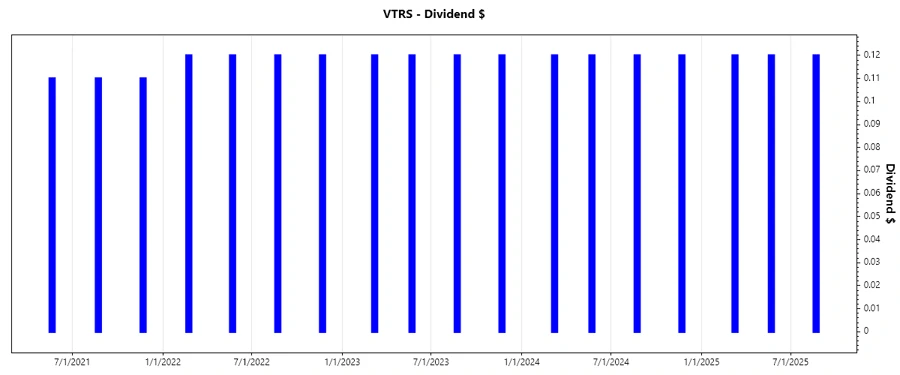
🗣️ Dividend History
Viatris' enduring commitment towards its dividend payments is highlighted through its 27-year history, reassuring investors of its strategic intent to reward shareholders. This historical perspective serves as a reflection of the company's inherent financial discipline and resilience against adverse market conditions.
| Year | Dividend Per Share (USD) |
|---|---|
| 2025 | $0.36 |
| 2024 | $0.48 |
| 2023 | $0.48 |
| 2022 | $0.48 |
| 2021 | $0.33 |
📈 Dividend Growth
The dividend growth over the years is an essential metric for assessing the potential for increasing shareholder value. Despite the financial strains, Viatris has demonstrated incremental growth in its dividend payouts, suggesting a gradual improvement in its financial strategy.
| Time | Growth |
|---|---|
| 3 years | 13.30% |
| 5 years | 31.95% |
The average dividend growth is 31.95% over 5 years. This shows moderate but steady dividend growth, indicating a strong commitment to value distribution.
✅ Payout Ratio
Payout ratios are critical for understanding a company's financial sustainability concerning its dividend obligations. Notably, payout ratios based on EPS are negative, reflecting a challenging financial position; the FCF based payout ratio at 30.21% implies manageable dividend distributions, underlining a sound plan for sustainable dividends.
| Key figure | Ratio |
|---|---|
| EPS-based | -16.29% |
| Free cash flow-based | 30.21% |
The negative EPS-based payout ratio is concerning, yet the FCF-based payout ratio shows that dividend payments remain well-covered, emphasizing a forward-looking dividend policy.
📉 Cashflow & Capital Efficiency
Analyzing cashflow metrics provides insight into the operational and strategic efficiency of the company. The Free Cash Flow Yield and Operating Cash Flow are robust, despite some depreciation in capital allocation efficiency.
| Metric | 2024 | 2023 | 2022 |
|---|---|---|---|
| Free Cash Flow Yield | 13.31% | 17.89% | 18.60% |
| Earnings Yield | -4.27% | 0.42% | 15.41% |
| CAPEX to Operating Cash Flow | 14.16% | 16.95% | 15.00% |
| Stock-based Compensation to Revenue | 1.09% | 1.17% | 0.72% |
| Free Cash Flow / Operating Cash Flow Ratio | 85.84% | 83.05% | 84.99% |
The data reveals a declining but still resilient cash flow management strategy, with significant Free Cash Flow Yield and disciplined capital allocation indicating potential for continued dividend maintenance.
Balance Sheet & Leverage Analysis
An analysis of the balance sheet reveals the company's leverage and risk management. The debt figures are aligned with industry standards, suggesting a well-balanced financial structure, though improvements could be made in liquidity ratios.
| Metric | 2024 | 2023 | 2022 |
|---|---|---|---|
| Debt-to-Equity | 0.77 | 0.90 | 0.91 |
| Debt-to-Assets | 0.34 | 0.39 | 0.39 |
| Debt-to-Capital | 0.43 | 0.47 | 0.48 |
| Net Debt to EBITDA | 4.81 | 5.03 | 2.80 |
| Current Ratio | 0.98 | 1.22 | 1.05 |
| Quick Ratio | 0.98 | 1.22 | 1.05 |
| Financial Leverage | 2.23 | 2.33 | 2.37 |
Overall, Viatris demonstrates an efficient leverage strategy with room for improvement in liquidity management, which could ultimately fortify its long-term financial stability.
Fundamental Strength & Profitability
The profitability ratios are currently under pressure, with negative returns on equity and assets. Despite this, gross margins are robust, indicating potential for future profitability if operational efficiencies are improved.
| Metric | 2024 | 2023 | 2022 |
|---|---|---|---|
| Return on Equity | -3.40% | 0.27% | 9.86% |
| Return on Assets | -1.53% | 0.11% | 4.16% |
| Net Margin | -4.30% | 0.35% | 12.78% |
| EBIT Margin | -0.50% | 5.03% | 20.94% |
| EBITDA Margin | 19.13% | 22.41% | 39.56% |
| Gross Margin | 38.15% | 41.74% | 39.95% |
| Research & Development to Revenue | 5.49% | 5.90% | 4.07% |
There are challenges in maintaining high profitability, but the company's investment in research & development could drive future growth and innovation, providing long-term value propositions.
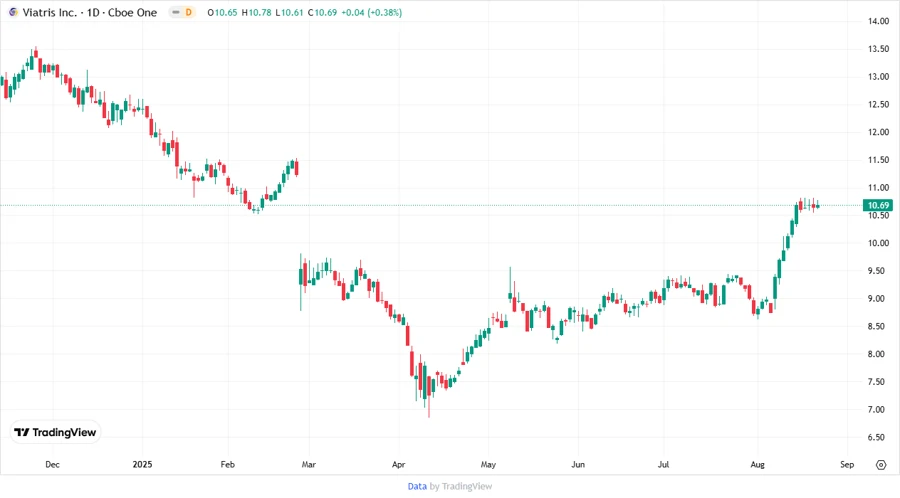
Price Development
Dividend Scoring System
| Category | Score | Score Bar |
|---|---|---|
| Dividend Yield | 4 | |
| Dividend Stability | 5 | |
| Dividend Growth | 3 | |
| Payout Ratio | 2 | |
| Financial Stability | 3 | |
| Dividend Continuity | 4 | |
| Cashflow Coverage | 3 | |
| Balance Sheet Quality | 3 |
Overall Score: 27/40
Rating
Based on the financial data and dividend metrics, Viatris Inc. presents a moderately attractive investment for dividend-seeking investors. Though current profitability and growth metrics indicate temporary pressure, the company’s longstanding history of dividend payments and adequate FCF coverage point towards a positive outlook for sustained dividend payouts. Investors should remain cautious of the negative earnings yields and closely monitor strategic financial adjustments aimed at profitability improvements.
Smart Data Insight
Master the Perfect Entry & Exit for this Stock
Don't leave your profits to chance. Historically, this stock follows specific seasonal patterns that institutional traders use to maximize returns.
- ✅ Identify the "Golden Buying Window"
- ✅ Avoid high-risk correction cycles
- ✅ Backtested data from the last 20+ years