July 09, 2025 a 12:46 pm


VTRS: Dividend Analysis - Viatris Inc.
Viatris Inc. demonstrates a notable dividend profile, reflecting its commitment to returning value to shareholders. Its consistent dividend history, coupled with substantial yield and cautious payout ratios, indicates a potentially stable income stream for investors. The company's solid dividend growth rate over recent years underscores its focus on sustainable financial practices, although caution is advised given the firm's negative earnings profile.
Overview 📊
Viatris Inc. is situated in the Healthcare sector, providing essential generic and specialty pharmaceuticals globally. It offers a competitive dividend yield of 7.24%, with a current per share dividend of USD 0.48. Viatris has a commendable track record of sustaining its dividend payments for the past 27 years, showcasing resilience and strength in financial commitments. The last dividend cut or suspension event is not recorded, demonstrating potential robustness in economic fluctuations.
| Metric | Value |
|---|---|
| Sector | Healthcare |
| Dividend Yield | 7.24% |
| Current Dividend Per Share | 0.48 USD |
| Dividend History | 27 years |
| Last Cut or Suspension | None |
Dividend History 🗣️
Viatris Inc.'s dividend history is a testament to its longstanding shareholder commitment—maintaining a steady payment for 27 years indicates substantial financial health. This history underpins the firm's reliability as a dividend-paying entity, appealing to income-focused investors. Sustaining dividends through economic cycles showcases resilience.
| Year | Dividend Per Share (USD) |
|---|---|
| 2025 | 0.24 |
| 2024 | 0.48 |
| 2023 | 0.48 |
| 2022 | 0.48 |
| 2021 | 0.33 |
Dividend Growth 📈
Understanding the growth rate of dividends provides insights into a company’s future dividend capacity and sustainability. Viatris Inc. shows a 3-year dividend growth rate of 13.3% and a 5-year growth rate of 31.9%, signifying a moderate but steady enhancement in dividend disbursements. A sustained dividend growth demonstrates the company's capacity to generate and increase stakeholder value.
| Time | Growth |
|---|---|
| 3 years | 13.30% |
| 5 years | 31.90% |
The average dividend growth is 31.9% over 5 years. This indicates a moderate but steady dividend growth trajectory, affirming Viatris Inc.'s reliability in enhancing shareholder returns consistently.
Payout Ratio 📉
A negative EPS payout ratio at -15.15% indicates that Viatris Inc. reinvests its earnings into the business, possibly prioritizing growth over payout. However, a manageable FCF payout ratio of 30.41% suggests a healthier liquidity position, allowing for sustained dividend payments without heavily impacting operational cash flow.
| Key Figure | Ratio |
|---|---|
| EPS-based | -15.15% |
| Free cash flow-based | 30.41% |
Cashflow & Capital Efficiency ✅
An analysis of Viatris Inc.'s cash flow and capital efficiency reveals insights into its fiscal management and operational effectiveness. With a negative net debt to EBITDA, the company's leverage strategy appears highly conservative or currently underutilized for operational growth.
| Metric | 2022 | 2023 | 2024 |
|---|---|---|---|
| Free Cash Flow Yield | 18.60% | 17.89% | 13.31% |
| Earnings Yield | 15.41% | 0.42% | -4.27% |
| CAPEX to Operating Cash Flow | 15.00% | 16.95% | 14.16% |
| Stock-based Compensation to Revenue | 0.71% | 1.17% | 0.99% |
| Free Cash Flow / Operating Cash Flow Ratio | 84.99% | 83.05% | 86.84% |
Despite fluctuating earnings and leverage metrics, Viatris' stable free cash flow positions it as an adaptable entity capable of fueling strategic initiatives while maintaining shareholder distributions.
Balance Sheet & Leverage Analysis ⚠️
Viatris Inc.'s financial health is supported by a reasonable Debt-to-Equity ratio, although Net Debt to EBITDA highlights financial stress and leverage challenges. Comprehensive balance sheet assessments inform on the firm's ability to manage liabilities while supporting operational expenditures.
| Metric | 2022 | 2023 | 2024 |
|---|---|---|---|
| Debt-to-Equity | 91.43% | 89.76% | 76.77% |
| Debt-to-Assets | 38.51% | 38.53% | 34.47% |
| Debt-to-Capital | 47.76% | 47.30% | 43.43% |
| Net Debt to EBITDA | 2.80 | 5.03 | 4.81 |
| Current Ratio | N/A | N/A | 1.65 |
| Quick Ratio | 1.05 | 1.22 | 0.98 |
Viatris’ strategic focus on strengthening its balance sheet amidst high leverage underscores its commitment to financial robustness, despite current liquidity constraints reflected in quick ratio declines.
Fundamental Strength & Profitability
Evaluating Viatris Inc.'s returns and margins offers insight into its operational profitability and market competitiveness, marking areas for performance optimization and investment growth potential.
| Metric | 2022 | 2023 | 2024 |
|---|---|---|---|
| Return on Equity | 9.86% | 0.27% | -3.40% |
| Return on Assets | 4.16% | 0.11% | -1.53% |
| Margins: Net | 12.78% | 0.35% | -4.30% |
| Margins: EBIT | 20.94% | 5.03% | -0.50% |
| Margins: EBITDA | 39.56% | 22.41% | 19.13% |
| Margins: Gross | 39.95% | 41.74% | 38.15% |
| R&D to Revenue | 4.07% | 5.90% | 5.49% |
Viatris' declining fundamental returns and erratic profitability margins suggest an urgent review of strategic and operational practices to leverage competitive market positioning effectively.
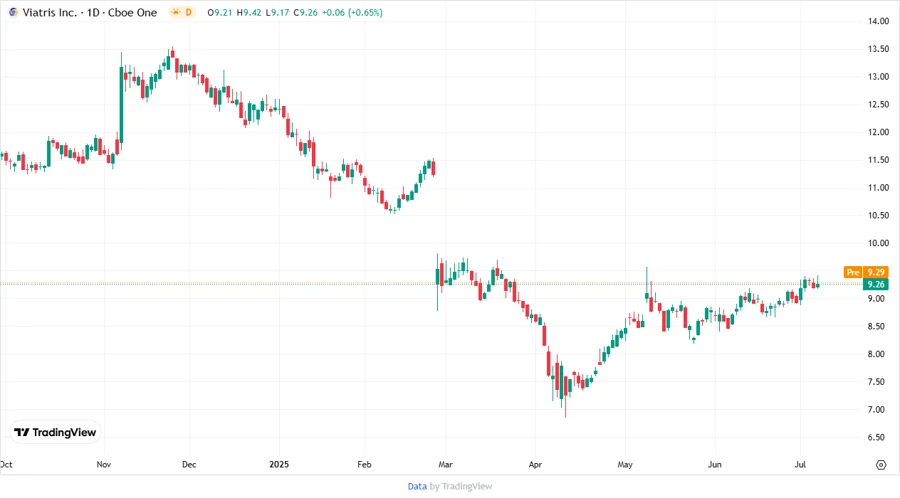
Price Development
Dividend Scoring System 🏆
| Criterion | Description | Score |
|---|---|---|
| Dividend Yield | High yield suggests attractive returns | 4.5 |
| Dividend Stability | Consistent history over 27 years | 4.0 |
| Dividend Growth | Moderate growth across 5 years | 3.5 |
| Payout Ratio | Prudent use of earnings and cash flow | 3.0 |
| Financial Stability | Under scrutiny due to leverage | 2.5 |
| Dividend Continuity | No suspensions on record | 4.5 |
| Cashflow Coverage | Strong overall coverage | 3.5 |
| Balance Sheet Quality | Concerns with rising debt levels | 2.5 |
Total Score: 28.0 / 40
Rating 📊
Overall, Viatris Inc. exhibits a robust dividend profile reflected in its attractive yield and long-standing payment history. Nonetheless, its negative earnings, coupled with challenges in financial leverage, suggest a cautious approach. Continuous monitoring of balance sheet improvements and strategic financial management is recommended, making it a suitable consideration for income-focused investors with a risk appetite for potential variability.
Smart Data Insight
Master the Perfect Entry & Exit for this Stock
Don't leave your profits to chance. Historically, this stock follows specific seasonal patterns that institutional traders use to maximize returns.
- ✅ Identify the "Golden Buying Window"
- ✅ Avoid high-risk correction cycles
- ✅ Backtested data from the last 20+ years