July 22, 2025 a 09:03 am
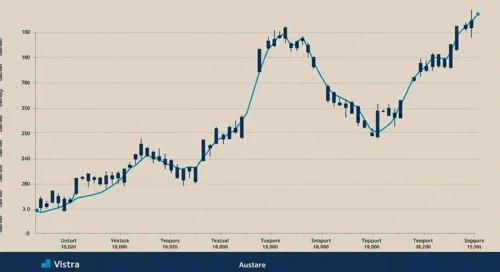
VST: Trend and Support & Resistance Analysis - Vistra Corp.
Vistra Corp., operating in retail electricity and power generation, has shown volatility in recent months. Following an initial dip, the stock has experienced a recovery with potential upward momentum. However, it faces significant resistance levels that it needs to surpass for further gains. The immediate market conditions and demand in energy will be crucial in determining the stock's direction.
Trend Analysis
| Date | Close Price | Trend |
|---|---|---|
| 2025-07-21 | 188.23 | ▼ |
| 2025-07-18 | 193.01 | ▲ |
| 2025-07-17 | 182.00 | ▼ |
| 2025-07-16 | 184.13 | ▲ |
| 2025-07-15 | 191.37 | ▲ |
| 2025-07-14 | 194.81 | ▲ |
| 2025-07-11 | 196.58 | ▲ |
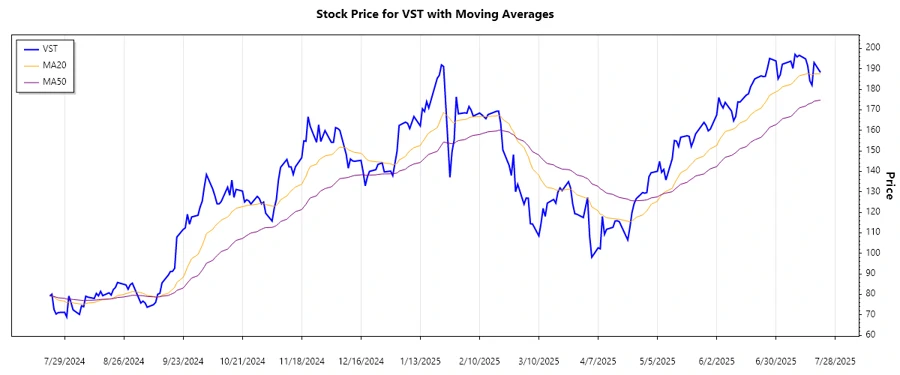
The EMA20 is greater than the EMA50, indicating an overall upward trend. However, recent fluctuations suggest the potential for short-term volatility. Investing decisions should consider the potential risk and monitor the price action closely.
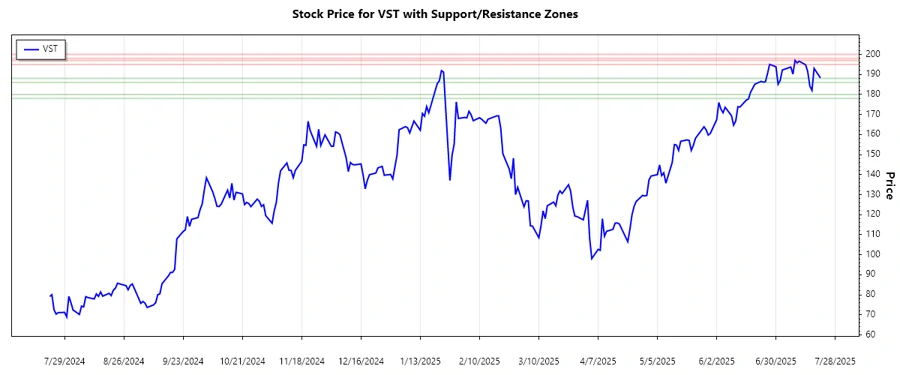
Support and Resistance
| Zone Type | From | To |
|---|---|---|
| Support 1 | 186.00 | 188.00 |
| Support 2 | 178.00 | 180.00 |
| Resistance 1 | 195.00 | 197.00 |
| Resistance 2 | 198.00 | 200.00 |
The current price is moving within the first support zone, suggesting that buying pressure may help prevent further declines. Breaching this zone would likely bring the next support into focus, while a rally could test the resistance levels at a higher price range.
Conclusion
Vistra Corp.'s stock shows an encouraging upward trend amidst a backdrop of potential resistance challenges. While the energy sector's variability adds a level of risk, the growing demand creates opportunity. Investors looking for entry should consider potential support levels as favourable buying opportunities. Overall, staying alert to market changes and technical signals will be crucial for realizing gains.
This analysis captures an upward trajectory in Vistra Corp. stock but notes the critical resistance levels that could obstruct further gains. Investors should weigh the volatility in the market against the consistent demand for energy to form strategies aligned with both current performance and potential growth opportunities.
Smart Data Insight
Master the Perfect Entry & Exit for this Stock
Don't leave your profits to chance. Historically, this stock follows specific seasonal patterns that institutional traders use to maximize returns.
- ✅ Identify the "Golden Buying Window"
- ✅ Avoid high-risk correction cycles
- ✅ Backtested data from the last 20+ years