May 23, 2026 a 08:00 am
VST: Fundamental Ratio Analysis - Vistra Corp.
Vistra Corp. is a significant player in the integrated retail electricity and power generation sector, serving a substantial customer base across the United States. The company's diversified energy portfolio and strategic activities position it competitively in the utilities industry. However, its financial ratios suggest potential areas for improvement, alongside promising investment opportunities.
Fundamental Rating
Vistra Corp.'s fundamental scores indicate a stable performance with room for enhancement in certain areas.
| Category | Score | Visual |
|---|---|---|
| Discounted Cash Flow | 1 | |
| Return on Equity | 5 | |
| Return on Assets | 5 | |
| Debt to Equity | 1 | |
| Price to Earnings | 2 | |
| Price to Book | 1 |
Historical Rating
The historical ratings highlight the company's progress and areas for continuous monitoring.
| Date | Overall | DCF | ROE | ROA | Debt/Equity | P/E | P/B |
|---|---|---|---|---|---|---|---|
| 2026-05-22 | 3 | 1 | 5 | 5 | 1 | 2 | 1 |
| Previous | 0 | 1 | 5 | 5 | 1 | 2 | 1 |
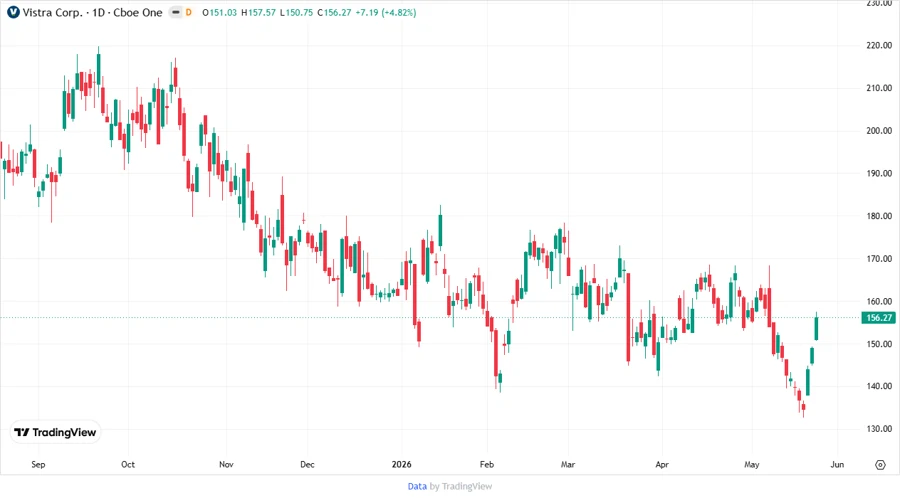
Analyst Price Targets
The price targets proposed by analysts provide a range of predictions, reflecting collective market sentiment.
| High | Low | Median | Consensus |
|---|---|---|---|
| 293 | 190 | 224.5 | 226.7 |
Analyst Sentiment
Analyst recommendations indicate a prevailing positive outlook on Vistra Corp.'s future performance.
| Recommendation | Count | Visual |
|---|---|---|
| Strong Buy | 0 | |
| Buy | 20 | |
| Hold | 2 | |
| Sell | 0 | |
| Strong Sell | 0 |
Vistra Corp. presents a balanced investment opportunity within the utilities sector. The company's stable financial metrics are complemented by positive analyst sentiment, indicating potential stock growth. However, investors should be aware of the risks associated with long-term energy market volatility and regulatory changes. The company's diverse energy generation portfolio remains a strength, providing resilience against market shifts. Therefore, Vistra Corp. could merit consideration for investors seeking utilities exposure with a moderate risk profile.
Smart Data Insight
Master the Perfect Entry & Exit for this Stock
Don't leave your profits to chance. Historically, this stock follows specific seasonal patterns that institutional traders use to maximize returns.
- ✅ Identify the "Golden Buying Window"
- ✅ Avoid high-risk correction cycles
- ✅ Backtested data from the last 20+ years