
July 08, 2026 a 10:15 am
VST: Fibonacci Analysis - Vistra Corp.
Vistra Corp. showcases a diverse portfolio in energy supply and generation, spanning multiple U.S. regions. Its stock has been active, influenced by market conditions and company performance across segments like retail and power generation.
Fibonacci Analysis
| Start Date | End Date | High Price | Low Price |
|---|---|---|---|
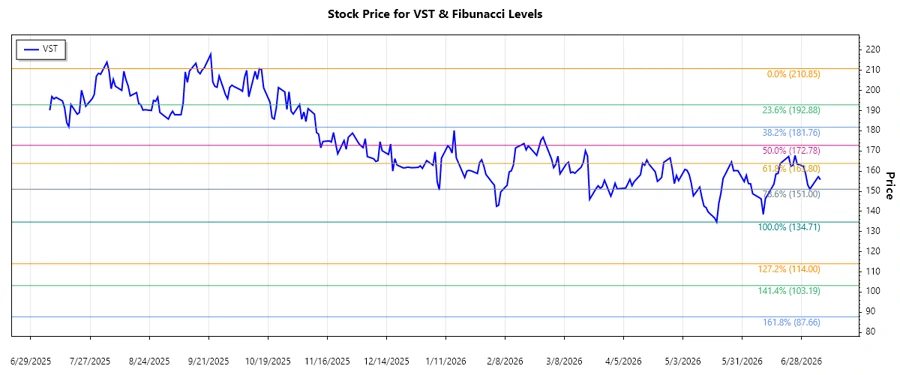
| 2025-10-16 | 2026-06-10 | $210.85 2025-10-15 |
$134.71 2026-05-19 |
| Fibonacci Level | Price Level |
|---|---|
| 0.236 | $151.96 |
| 0.382 | $162.46 |
| 0.5 | $172.78 |
| 0.618 | $183.09 |
| 0.786 | $196.64 |
The current price is within the 0.382 retracement zone, indicating potential resistance or support around this level. This technical setup suggests traders might look for buying or selling opportunities based on this retracement level.
Conclusion
Vistra Corp. has experienced significant fluctuations, particularly within its robust energy market presence. The recent trend identifies important Fibonacci levels, useful for traders assessing potential buy or sell points. Vistra’s diverse energy portfolio, coupled with external market factors, suggests cautious optimism. Investors should consider both opportunities and risks associated with potential energy regulation changes and shifts in demand. Analysts remain watchful of price movements near key retracement zones for informed decision-making.
Smart Data Insight
Master the Perfect Entry & Exit for this Stock
Don't leave your profits to chance. Historically, this stock follows specific seasonal patterns that institutional traders use to maximize returns.
- ✅ Identify the "Golden Buying Window"
- ✅ Avoid high-risk correction cycles
- ✅ Backtested data from the last 20+ years