
June 11, 2026 a 11:31 am

VST: Dividend Analysis - Vistra Corp.
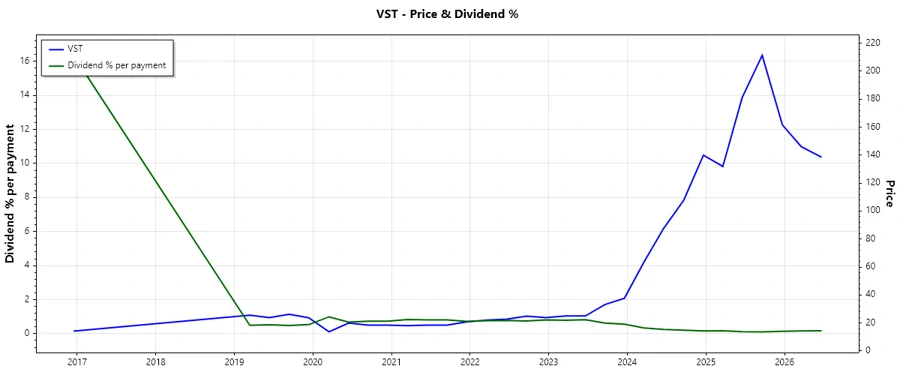
This comprehensive analysis of Vistra Corp.'s dividend profile reveals a company with potential yet underutilised dividend distribution. A sustainable dividend yield coupled with growing payout ratios highlights Vistra's commitment to returning value to shareholders. However, the relatively low dividend yield of 0.66% indicates room for potential growth, aligning with their moderate dividend growth strategy.
📊 Overview
Vistra Corp., operating within the utilities sector, has a stable yet modest dividend profile that offers potential for growth. The company's dividend yield stands at 0.66%, with a current dividend per share of USD 1.47. Notably, Vistra has maintained a consistent dividend history for the past 9 years, with no recent cuts or suspensions.
| Category | Details |
|---|---|
| Sector | Utilities |
| Dividend yield | 0.66% |
| Current dividend per share | 1.47 USD |
| Dividend history | 9 years |
| Last cut or suspension | None |
🗣️ Dividend History
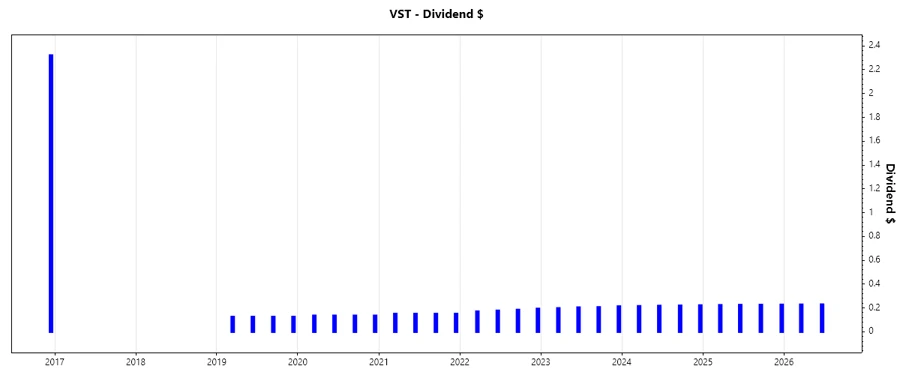
A strong dividend history indicates reliability and confidence among investors. Vistra Corp. has a positive track record in dividend payments, reflecting consistent revenue flow and financial stability.
| Year | Dividend per Share (USD) |
|---|---|
| 2026 | 0.457 |
| 2025 | 0.9015 |
| 2024 | 0.8735 |
| 2023 | 0.8205 |
| 2022 | 0.724 |
📈 Dividend Growth
Vistra Corp. demonstrates moderate dividend growth over the years, a vital marker of financial health and shareholder reward. This growth ensures investors of future dividend income stability and potential appreciation in payout ratios.
| Time | Growth |
|---|---|
| 3 years | 7.58% |
| 5 years | 10.79% |
The average dividend growth is 10.79% over 5 years. This shows moderate but steady dividend growth.
📉 Payout Ratio
The payout ratio is a crucial indicator of dividend sustainability. Vistra Corp. displays an EPS-based payout ratio of 22.22% and a FCF-based payout ratio of 51.21%. This suggests a balanced approach to dividends, leaving room for reinvestment into business operations.
| Key figure | Ratio |
|---|---|
| EPS-based | 22.22% |
| Free cash flow-based | 51.21% |
The payout ratios are healthy, indicating that Vistra's dividends are sustainable without overextending financial commitments, thus securing future payout capabilities.
✅ Cashflow & Capital Efficiency
Analyzing cashflow and capital efficiency provides insight into how effectively Vistra Corp. manages its financial resources to support dividend payments. A high free cash flow yield suggests ample liquidity for continued dividends, reinvestments, and strategic acquisitions.
| Year | 2023 | 2024 | 2025 |
|---|---|---|---|
| Free Cash Flow Yield | 26.52% | 5.23% | 0.24% |
| Earnings Yield | 10.48% | 5.59% | 1.72% |
| CAPEX to Operating Cash Flow | 30.73% | 45.54% | 96.83% |
| Stock-based Compensation to Revenue | 0.50% | 0.52% | 0.67% |
| Free Cash Flow / Operating Cash Flow Ratio | 69.26% | 54.46% | 3.17% |
Stability in cash flow and efficient capital utilization strongly indicates Vistra's robust earning power and efficient resource management, promoting better returns on capital invested.
✅ Balance Sheet & Leverage Analysis
Understanding the balance sheet and leverage allows investors to assess Vistra's financial health. An appropriate debt structure ensures operational stability and financial freedom to support dividend payments in turbulent markets.
| Year | 2023 | 2024 | 2025 |
|---|---|---|---|
| Debt-to-Equity | 276.69% | 311.74% | 399.12% |
| Debt-to-Assets | 44.54% | 45.97% | 49.09% |
| Debt-to-Capital | 73.45% | 75.71% | 79.96% |
| Net Debt to EBITDA | 2.43 | 2.25 | 3.48 |
| Current Ratio | 0.89 | 0.85 | 0.78 |
| Quick Ratio | 1.11 | 0.85 | 0.69 |
| Financial Leverage | 6.21 | 6.78 | 8.13 |
A high debt-to-equity ratio indicates high leverage which could pose a risk in downturn periods but currently showcases an aggressive approach towards expansion and returns enhancement.
📉 Fundamental Strength & Profitability
Fundamental strength and profitability measures, such as margin ratios and R&D investment, are critical to understanding Vistra's market position and future growth potential. Strong margins indicate cost-effectiveness and competitive pricing.
| Year | 2023 | 2024 | 2025 |
|---|---|---|---|
| Return on Equity | 28.13% | 47.74% | 18.47% |
| Return on Assets | 4.53% | 7.04% | 2.27% |
| Margins: Net | 9.61% | 13.72% | 5.56% |
| Margins: EBIT | 17.68% | 23.54% | 13.56% |
| Margins: EBITDA | 29.69% | 37.12% | 30.95% |
| Margins: Gross | 33.27% | 39.70% | 17.52% |
| Research & Development to Revenue | 0% | 0% | 0% |
Vistra Corp.'s impressive profitability margins illustrate a strong cost control mechanism and robust revenue stream, fostering long-term growth and shareholder value creation.
📊 Price Development & Analysis
Dividend Scoring System
| Criteria | Score | Indicator |
|---|---|---|
| Dividend yield | 2 | |
| Dividend Stability | 4 | |
| Dividend Growth | 3 | |
| Payout Ratio | 3 | |
| Financial Stability | 3 | |
| Dividend Continuity | 4 | |
| Cashflow Coverage | 3 | |
| Balance Sheet Quality | 3 |
Total Score: 25/40
Rating
Vistra Corp. displays strong dividend potential balanced by moderate risk. Although the current yield is modest, robustness in profit margins and cashflows suggests sustainable future growth. Investors seeking long-term stability with dividend appreciation potential may find Vistra an attractive prospect.
Smart Data Insight
Master the Perfect Entry & Exit for this Stock
Don't leave your profits to chance. Historically, this stock follows specific seasonal patterns that institutional traders use to maximize returns.
- ✅ Identify the "Golden Buying Window"
- ✅ Avoid high-risk correction cycles
- ✅ Backtested data from the last 20+ years